

What to know:
- Ethereum price is under strong selling pressure, dropping 5.15% in 24 hours to around $1,873 while testing key support near $1,825.
- Analysts note that holding above $1,825 could trigger a rebound toward $2,070 and potentially $2,360.
- A break below $1,825 may open the door for a deeper decline toward the $1,500 zone.

Ethereum (ETH) price continues to be pressured following the significant drop experienced over the last 24 hours, moving towards the important support area that may shape the future trend. The market will be watching to see whether the bulls can manage to protect this support level or not.
At the time of writing, ETH is trading at $1,824.69, with a 24-hour trading volume of $33.76 billion and a market capitalization of $226.08 billion. Over the last 24 hours, ETH has dropped by 5.64%, reflecting continued selling pressure across the market.


Source: CoinMarketCap

Also Read | UK FCA Warns Football Clubs of Urgent Crypto Risks 2026
Ethereum Price Tests Key $1,825 Support
A prominent crypto analyst, Ali Martinez, mentioned on June 3, 2026, that the Ethereum price achieved his bearish target of $1,825. According to Martinez, the ETH is currently trading at the lower end of its price channel, which can prove very significant for the next direction of the cryptocurrency.
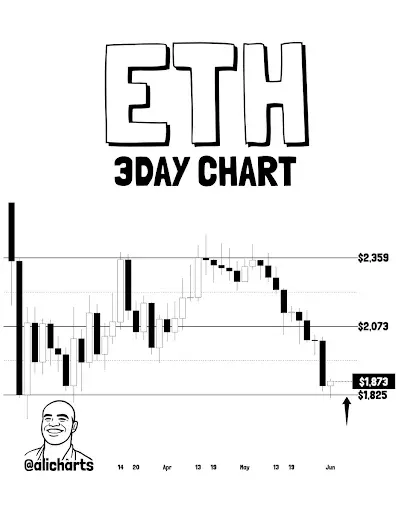

Source: Ali Martinez’s X Post
Martinez explained that if the ETH can manage to stay above the $1,825 support level, then a rally is imminent. Under this situation, the crypto will bounce back to the resistance levels of $2,070 and maybe even up to $2,360
However, he also noted that a sustained decline below $1,825 on a day-to-day basis would undermine the existing support zone.
In that scenario, there is a likelihood of further selling of Ethereum, and its price will move towards the $1,500 region. That said, investors are watching keenly how investors respond at this significant support zone.
Ethereum Flashes Oversold Signal as Bears Keep Control
Technical signals indicate that the Ethereum price could be in a highly oversold condition. This is evident from the RSI indicator moving down to levels of 24.95, significantly lower than the 30 level, used to signal an oversold condition.
The RSI signal line is currently reading 32.63, implying that the selling is more than the buying for some time now. It is important to note that the oversold RSI will often result in a rebound; however, it is important to bear in mind that this may not always be the case.

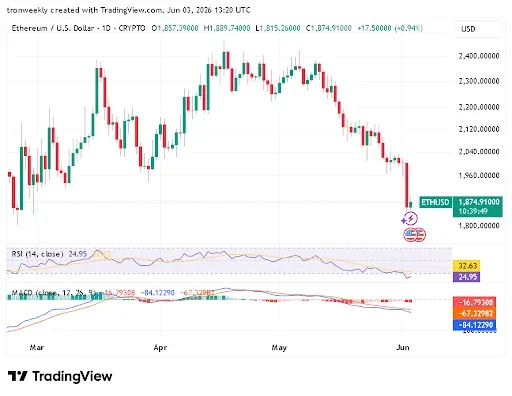
Source: TradingView
The MACD indicator also indicates that the market continues to be weak. The value of the MACD is -84.12, whereas the signal value is -67.33. Moreover, the histogram shows a value of -16.79, which is negative.
As long as the MACD line stays below the signal line, it is safe to assume that there is an ongoing bearish trend and that bears are controlling the market movement. Moreover, the bearish histogram also reinforces this view as it indicates downward momentum.
Overall, the Ethereum price seems to be testing a very crucial support level lately. Breaking above $1,825 would pave the way for potential rallies towards higher goals; on the contrary, a breakdown through this support level could raise the likelihood of a stronger drop.
As long as technical indicators are in the red, what happens at these levels will determine the next direction for the Ethereum price.
This article contains market analysis and price predictions. These are not guarantees. Crypto markets are volatile. Always DYOR. Not financial advice.
Also Read | SEC Strategy Targets Blockchain Growth and Digital Asset Regulation by 2030

Be the first to comment