


What to know:
- FET shows higher lows near $0.27–$0.28 resistance, signaling bullish momentum and breakout pressure.
- A breakout above $0.28 could flip resistance to support, opening targets toward $0.32–$0.36.
- FET has broken a multi-month downtrend, with potential expansion toward the $1 psychological level.

FET is showing higher lows and building strength near a key resistance zone, suggesting buyers are gradually gaining control. A breakout could confirm a bullish shift in the FET price and lead to further upside, while failure may keep the price in consolidation. Market activity also reflects cautious participation.
At the time of writing, FET is trading at $0.2213 with a 24-hour trading volume of $317.5 million and a market capitalization of $499.86 million. Despite the 16.17% loss over the last 24 hours, the question is whether the FET price could make a rebound or lead to deeper corrections.
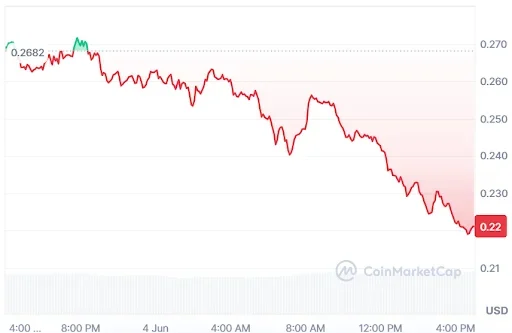

Source: CoinMarketCap

FET Price Eyes Major Move After Higher Lows Formation
However, the crypto analyst Chiefrat pointed out that the FET price is currently approaching a key breakout zone near $0.27–$0.28, where price has repeatedly faced resistance.
Recent structure shows higher lows forming, signaling that buyers are gradually gaining strength and absorbing selling pressure. This shift suggests growing accumulation, with market participants closely watching whether momentum can continue building into a decisive breakout attempt above resistance.
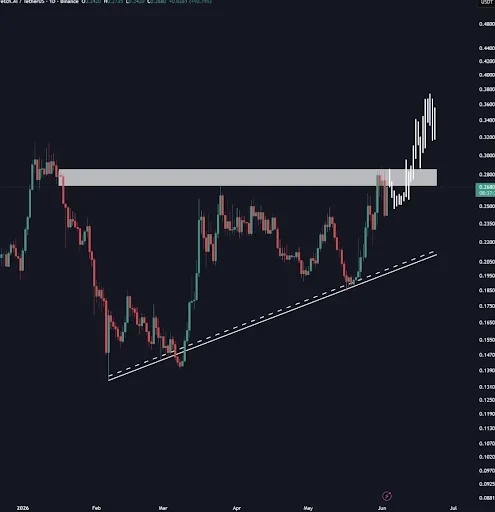

Source: Chiefrat’s X Post
A clean break and steady hold above the $0.27–$0.28 area would confirm a bullish shift, turning former resistance into support.
If this happens, the FET price could head towards the next upside target between $0.32 and $0.36. However, if it fails, market consolidation is likely as it waits for a clearer direction.
Also Read: FET Price Eyes 350% Surge Potential As Cycle Structure Repeats Across Markets
FET Price Action Signals Potential Expansion Toward $1
Moreover, another crypto analyst, Team LAMBO, pointed out that the FET price has risen above a longtime weekly downtrend, testing previous resistance as support.
This indicates that buyers might be back in control after a lengthy bearish stretch. The breakout above the two-year downtrend line shows more momentum and increasing confidence in a trend reversal.
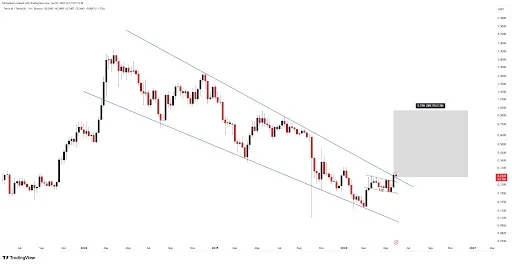

Source: Team LAMBO’s X Post
If this pattern holds, traders will keep targeting $1.00 as the key upside goal for the FET price. This level works as a barrier and is where previous supply kicked in. Higher low support in the weekly candles could fuel the uptick.
Overall, the FET price action hints at the initial stages of an expansion following a lengthy accumulation phase and a potential trend shift.
FET Derivative Data Point to Increasing Pressure
However, the FET open interest dropped 25.07% to $83.89 million. This shows a large decline in open derivative positions. Traders closed or cut their exposure, hinting at less speculation and a more cautious stance in the market.
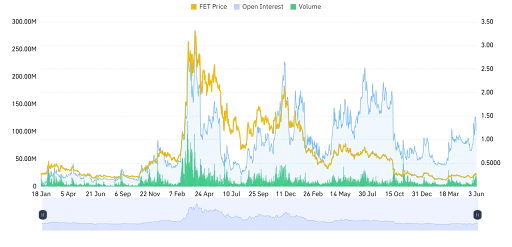

Source: Coinglass
Trading volume dropped 2.32%, ending at $274.45 million. That indicates less activity lately. The dip could be from market consolidation or investors being hesitant for now.
This article contains market analysis and price predictions. These are not guarantees. Crypto markets are volatile. Always DYOR. Not financial advice.
Also Read: FET Price Prediction: Bullish Breakout Signals Massive Rally Toward $1

Be the first to comment