


What to know:
- Celestia (TIA) breaks a descending wedge, signaling a possible bullish reversal, but needs strong volume above resistance.
- Indicators show oversold conditions as TIA drops below the Bollinger Band, hinting at recovery or further downside.
- Resistance at $2.35–$3.95 may cause consolidation, while a breakout could target $9.00.

Celestia (TIA) shows a breakout from a long descending wedge, suggesting potential bullish reversal, but strong resistance ahead and dominant bearish indicators keep the outlook mixed, making future direction dependent on volume, momentum, and whether the Celestia price can sustain itself above key breakout levels or retest prior structures.
At the time of writing, TIA is trading at $0.3011 with a 24-hour trading volume of $48.64 million and a market capitalization of $277.01 million. Despite the loss of 12.35% over the last 24 hours, the question is whether the TIA price could maintain its movement in descending wedge formation.


Source: CoinMarketCap

Also Read: Celestia Price Outlook: TIA Price Breakout Targets a Potential 300–400% Rally
Celestia Price Structure Points to Major Move to $9
Furthermore, the crypto analyst Atakan Altun Öz highlighted that Celestia (TIA) has broken out of a long-standing descending wedge that constrained the Celestia price for months. Fresh green candles from accumulation lows indicate seller exhaustion and early bullish control.
The breakout signals a potential macro reversal, with structure shifting from compression to expansion as momentum begins rebuilding across the market, supported by strong volume confirmation.


Source: Atakan Altun Öz’s X Post
In its aftermath, the Celestia price is approaching important Fibonacci resistance levels ranging from $2.35 to $3.95. Consolidation is expected at this stage due to profit-taking by shareholders.
In the event that the current momentum persists, the extended target would be the $9.00 region in line with the 0.786 Fibonacci level, which could be indicative of a staged bullish advance.
The Celestia price seems ready to go from periods of buildup to the initial phases of expansion; however, success depends on maintaining adequate volume and follow-through from the market.
If the Celestia price does not maintain its levels during the breakout phase, a test of the wedge formation is a possibility; otherwise, a continuation of growth may quicken the pace with proper risk control.
Bollinger Bands and EMAs Point to Bearish Dominance
According to TradingView, the bearish nature is well reflected by the Celestia price through the daily drop of 11.12% to $0.29967.
The significant plunge crosses the support level of the lower Bollinger band at $0.32301, showing that the market is oversold. High activity below the moving average of a 20-day period ($0.40193) indicates a short-term downtrend.
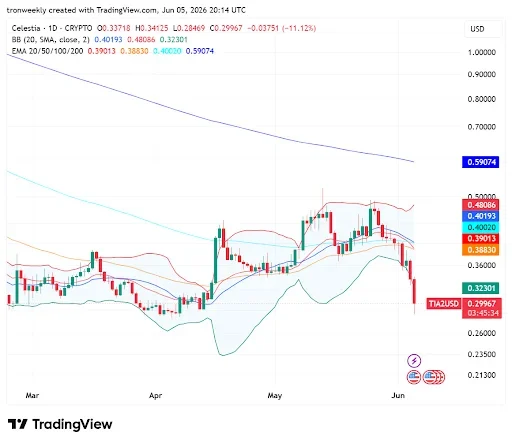

Source: TradingView
However, indicators over longer periods confirm that there is a sustained macro downtrend. The 20-day and 50-day EMAs are closely positioned below the 100-day EMA, while the 200-day EMA is way up at $0.59074, providing resistance at the top. The Celestia price, after rallying briefly to $0.50 in May, is promptly rejected in June.
This article contains market analysis and price predictions. These are not guarantees. Crypto markets are volatile. Always DYOR. Not financial advice.
Also Read: Celestia Price Prediction: TIA Price Breakout Signals a Rally Toward $2.70

Be the first to comment