

What to know:
- Hyperliquid price fell to a recent low of $56 as Bitcoin’s decline triggered a broader altcoin sell-off.
- HYPE broke below a key ascending trendline, signaling weakening bullish momentum and increased downside risk.
- Despite the correction, HYPE remains above major moving averages, keeping its long-term bullish structure intact.

Hyperliquid price was under significant downward pressure due to the overall market correction following the fall in the price of Bitcoin. This resulted in the token dropping to its lowest point at $56.
At the time of writing, Hyperliquid price stands at $59.49, with a 24-hour trading volume of $2.99 billion and a market cap of $15.07 billion. However, despite bouncing back from its recent low, the HYPE price is currently trading lower by 0.63% on a daily basis.

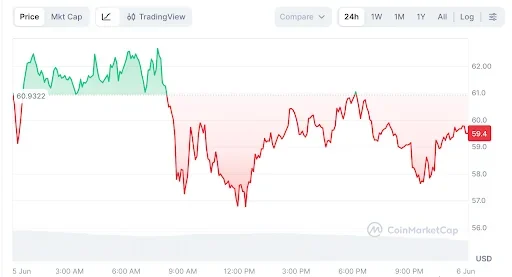
Source: CoinMarketcap

Hyperliquid Price Breaks Key Ascending Trendline
According to crypto analysis platform FOUR, Hyperliquid price has broken below a critical ascending trendline that had supported the token’s bullish structure throughout its recent rally. The breakdown signals weakening bullish momentum and raises the possibility of a deeper correction if buyers fail to reclaim lost support levels.

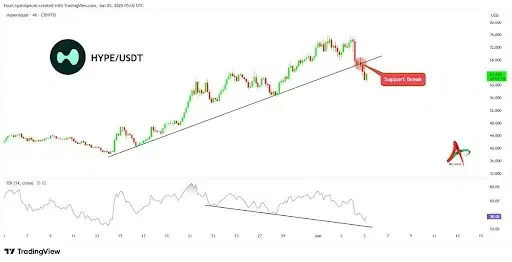
Source: X
The loss of trendline support comes as Bitcoin’s decline continues to pressure altcoins across the market. Historically, such breakdowns often lead to increased volatility as traders reassess market direction and key support zones.
Analysts note that a quick recovery above the broken trendline would help restore confidence. However, failure to do so could leave HYPE vulnerable to additional downside pressure in the near term.
Hyperliquid price Maintains Strong Long-Term Bullish Structure
Despite the recent correction, the broader technical outlook for Hyperliquid price remains constructive. HYPE recently surged to a local high near $75 before entering a cooling phase driven by profit-taking and broader market weakness.
The token continues to trade above all major exponential moving averages, a sign that the long-term trend remains bullish. The 20-day EMA currently sits at $60.96, while the 50-day EMA is positioned at $52.82. Longer-term support remains intact with the 100-day EMA at $46.18 and the 200-day EMA at $41.01.


Source: Tradingview
The alignment of these moving averages suggests that buyers still control the broader trend despite short-term weakness. As long as HYPE remains above the 50-day EMA, the overall market structure favors bulls.
Also Read: VIRTUAL Price Sets Sights on $1 as Chainlink CCIP Upgrade Boosts Confidence
MACD Flashes Bearish Signal as Momentum Cools
While there are long-term fundamentals that suggest a positive trend, short-term signals show a decline in momentum, with the crypto having dropped below its 20-day exponential moving average recently, signaling a slowdown in bullish momentum despite the sharp rise seen recently.
Furthermore, there is also a bearish MACD crossover that shows an increasing level of downward pressure on prices, with the MACD line having moved below the signal line, and the histogram being negative. However, even with a bearish MACD crossover, the formation of a downtrend is still unlikely.
Key Support and Resistance Levels
The critical support area at the moment is around $52 to $53, which is very close to the 50-day EMA. Holding this range will increase the probability of more bullish activity in the long term and create a base for a possible rebound.
As far as resistance goes, breaking above the 20-day EMA at $61 is the first indication that buyers have taken control. A break above this level could help boost morale and allow the price to potentially test new levels closer to $75.
At the moment, traders are only concentrating on whether the price is able to hold support above crucial moving averages despite unfavorable conditions in the cryptocurrency space.
Can Hyperliquid Price Recover After the Pullback?
Hyperliquid is still among the top-performing digital assets during the ongoing market cycle even in light of its pullback. Nevertheless, the near-term price movement of the token will probably be dictated by Bitcoin’s stability and the entry of buyers at crucial support levels.
As long as HYPE manages to maintain itself above the $52-$53 range and break higher around significant resistance zones, the bullish trajectory may hold. Otherwise, volatility will most certainly continue as the markets react to macroeconomic and crypto-related events.
This article contains market analysis and price predictions. These are not guarantees. Crypto markets are volatile. Always DYOR. Not financial advice.
Also Read: Solana Logs 8 Straight Red Months, Down 36.4% in 2026

Be the first to comment