

What to know:
- XRP shows long-term wedge support near $1.10–$1.20 with final support at $0.95.
- Upside projections include $3.65 and extended targets near $14.
- Analysts highlight the accumulation phase before the next cycle.

Celal Kucuker noted that the XRP price is forming one of the clearest long-term setups seen on monthly charts, with a cup and handle structure still active.
The chart suggests the XRP price may revisit the 1.618 Fibonacci extension near a potential dip zone around $0.95 before any major upside move begins.
Starting from somewhere between $1.10 and $1.20, there has been a profound correction that has been running for a couple of months after the prior high in the XRP price, which was close to $3.60.

According to this interpretation, the selling momentum is slowing down, while buyers continue holding crucial support zones. If the formation remains valid, XRP may attempt recovery towards more resistance levels.


Source: X
Wedge Structure and Fibonacci Pressure Zones
The above chart indicates the XRP price trading within a wide wedge formation descending from above the highs of $3.60-$3.65. It is noteworthy that a similar pattern tends to be associated with the end of a trend following a reduction in selling pressure on the asset.
The XRP price at the moment touches the bottom boundary close to $1.10-$1.20, where one can see several Fibonacci levels.
These levels represent the key zones where a reversal should take place. In case of breaking through the current level, the final support at the 0.236 retracement around $0.95 will become the point at which the outlook for the XRP price can change.
If buyers manage to hold these levels, a gradual rounding will form, leading to a breakout towards $3.65 and further.
Also Read: Chiliz Price Drops to Multi-Year Low as Analysts Eye Potential Rally Toward $0.65
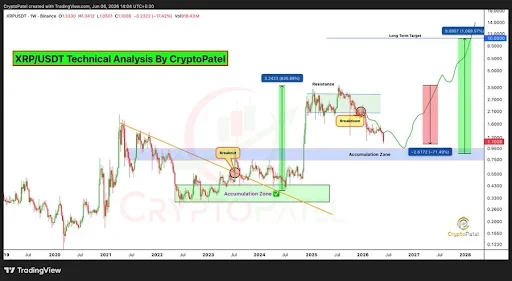
XRP Price Accumulation Phase and Long-Term Cycle Perspective
According to CryptoPatel, the XRP price trades at close to $1, registering an enormous drop of 71% off its record high price level, but from the chart, there seems to be buying activity rather than failure of the trend.
This analysis highlights that the XRP price currently finds an important zone of support at $0.40-$0.95, which was once its base level prior to its 800% spike in late 2024.
Since the break above the lengthy bear trend channel, the asset has initiated a pullback move to assess whether a new consolidation will be formed.

Source: X
According to the forecast, the decline may extend further towards the indicated accumulation range that should attract more investors.
Although short-term pressure can still be noticed, the larger cycle approach to the matter views the retracement as an element of the overall trend continuation and not reversal.
Following historical precedent, the XRP price could trade sideways for a few months before making any attempt to break out again. In this situation, the recovery targets would be in the $5 and $10 zones.
This article contains market analysis and price predictions. These are not guarantees. Crypto markets are volatile. Always DYOR. Not financial advice.
Also Read: ADA Price Forecast: Fibonacci Support Signals Recovery Toward $0.54 Target
Be the first to comment