


The meme coin Shiba Inu (SHIB) has reached levels not seen since early March due to a clear breakdown from its multi-month consolidation structure.
Easier recovery
Although the move itself appears to be negative on the surface, a number of technical indicators point to SHIB possibly entering the best stage for a long-term recovery effort.
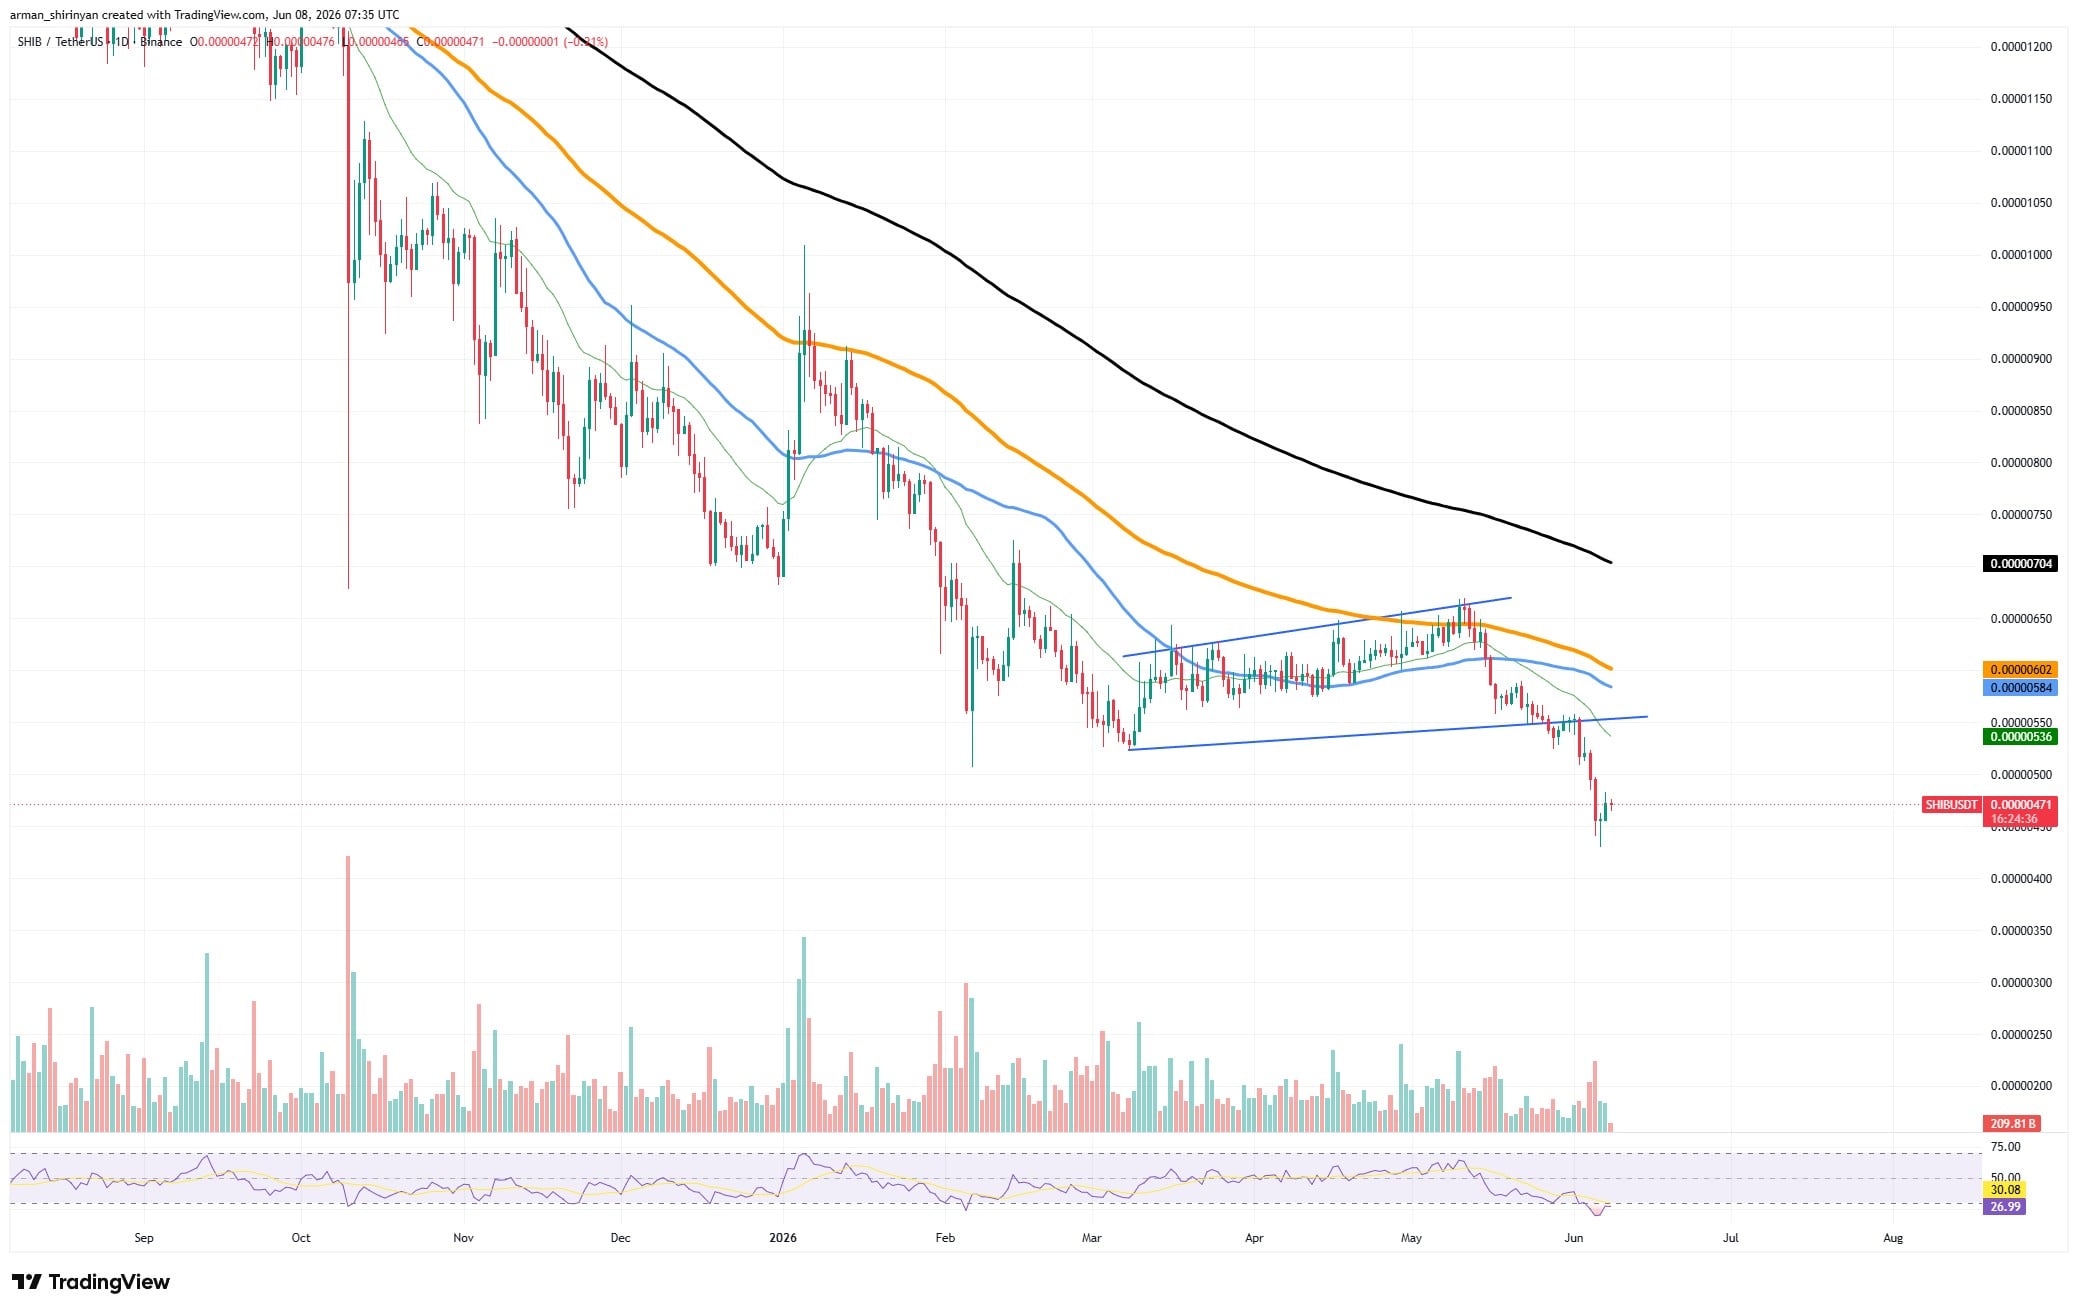
The Relative Strength Index (RSI), which has fallen into oversold territory, is the most notable development. In the past, times when SHIB’s daily RSI drops below 30 have frequently been associated with seller fatigue and set the stage for at least a brief relief rally. The RSI is still close to 27 as of this writing, suggesting that the bearish momentum has been stretched.

But traders shouldn’t assume that a V-shaped recovery will happen right away. Volume behavior is one element preventing a quick recovery. Trading volume has been steadily declining during the reversal process as SHIB tries to stabilize following the steep decline. Strong recoveries should ideally be accompanied by rising volume, as buyers absorb the selling pressure. The current configuration implies that market players are still cautious, which lowers the likelihood of a quick breakout back toward prior highs.
You Might Also Like

From a trend standpoint, SHIB is still below the 50-day, 100-day, and 200-day moving averages. Bears continue to dominate the overall trend, as evidenced by the recent breakdown from the rising channel that formed between March and May.
Positive risk-reward structure
However, there is an intriguing risk-reward setup due to the current oversold situation. The first recovery target is located between $0.0000054 and $0.0000055, close to the 50-day moving average. SHIB would be able to challenge the 100-day moving average around $0.0000058 if it were to successfully push above this zone. The 200-day moving average at $0.0000060, which is also in line with the previous channel breakdown zone, continues to be the main resistance area after that.
Any upward movement should be considered a recovery rally within a broader downtrend until SHIB regains these levels. Nevertheless, the asset has reached a point where downward momentum is getting harder to maintain after months of consistent selling pressure and a severely oversold RSI reading.
Whether buyers can turn technical exhaustion into a significant trend reversal or just create another fleeting bounce will be determined in the upcoming sessions.

Be the first to comment