


Despite all the off/on ceasefires and ‘agreements’ in the Middle East conflict that have had up and down impacts on the U.S. stock market, the bear market for Bitcoin is persistent and ongoing. A quick rally above $64K could be at an end and it now remains to be seen if the next drop will take place and how bad it could be?
A bear flag or not?
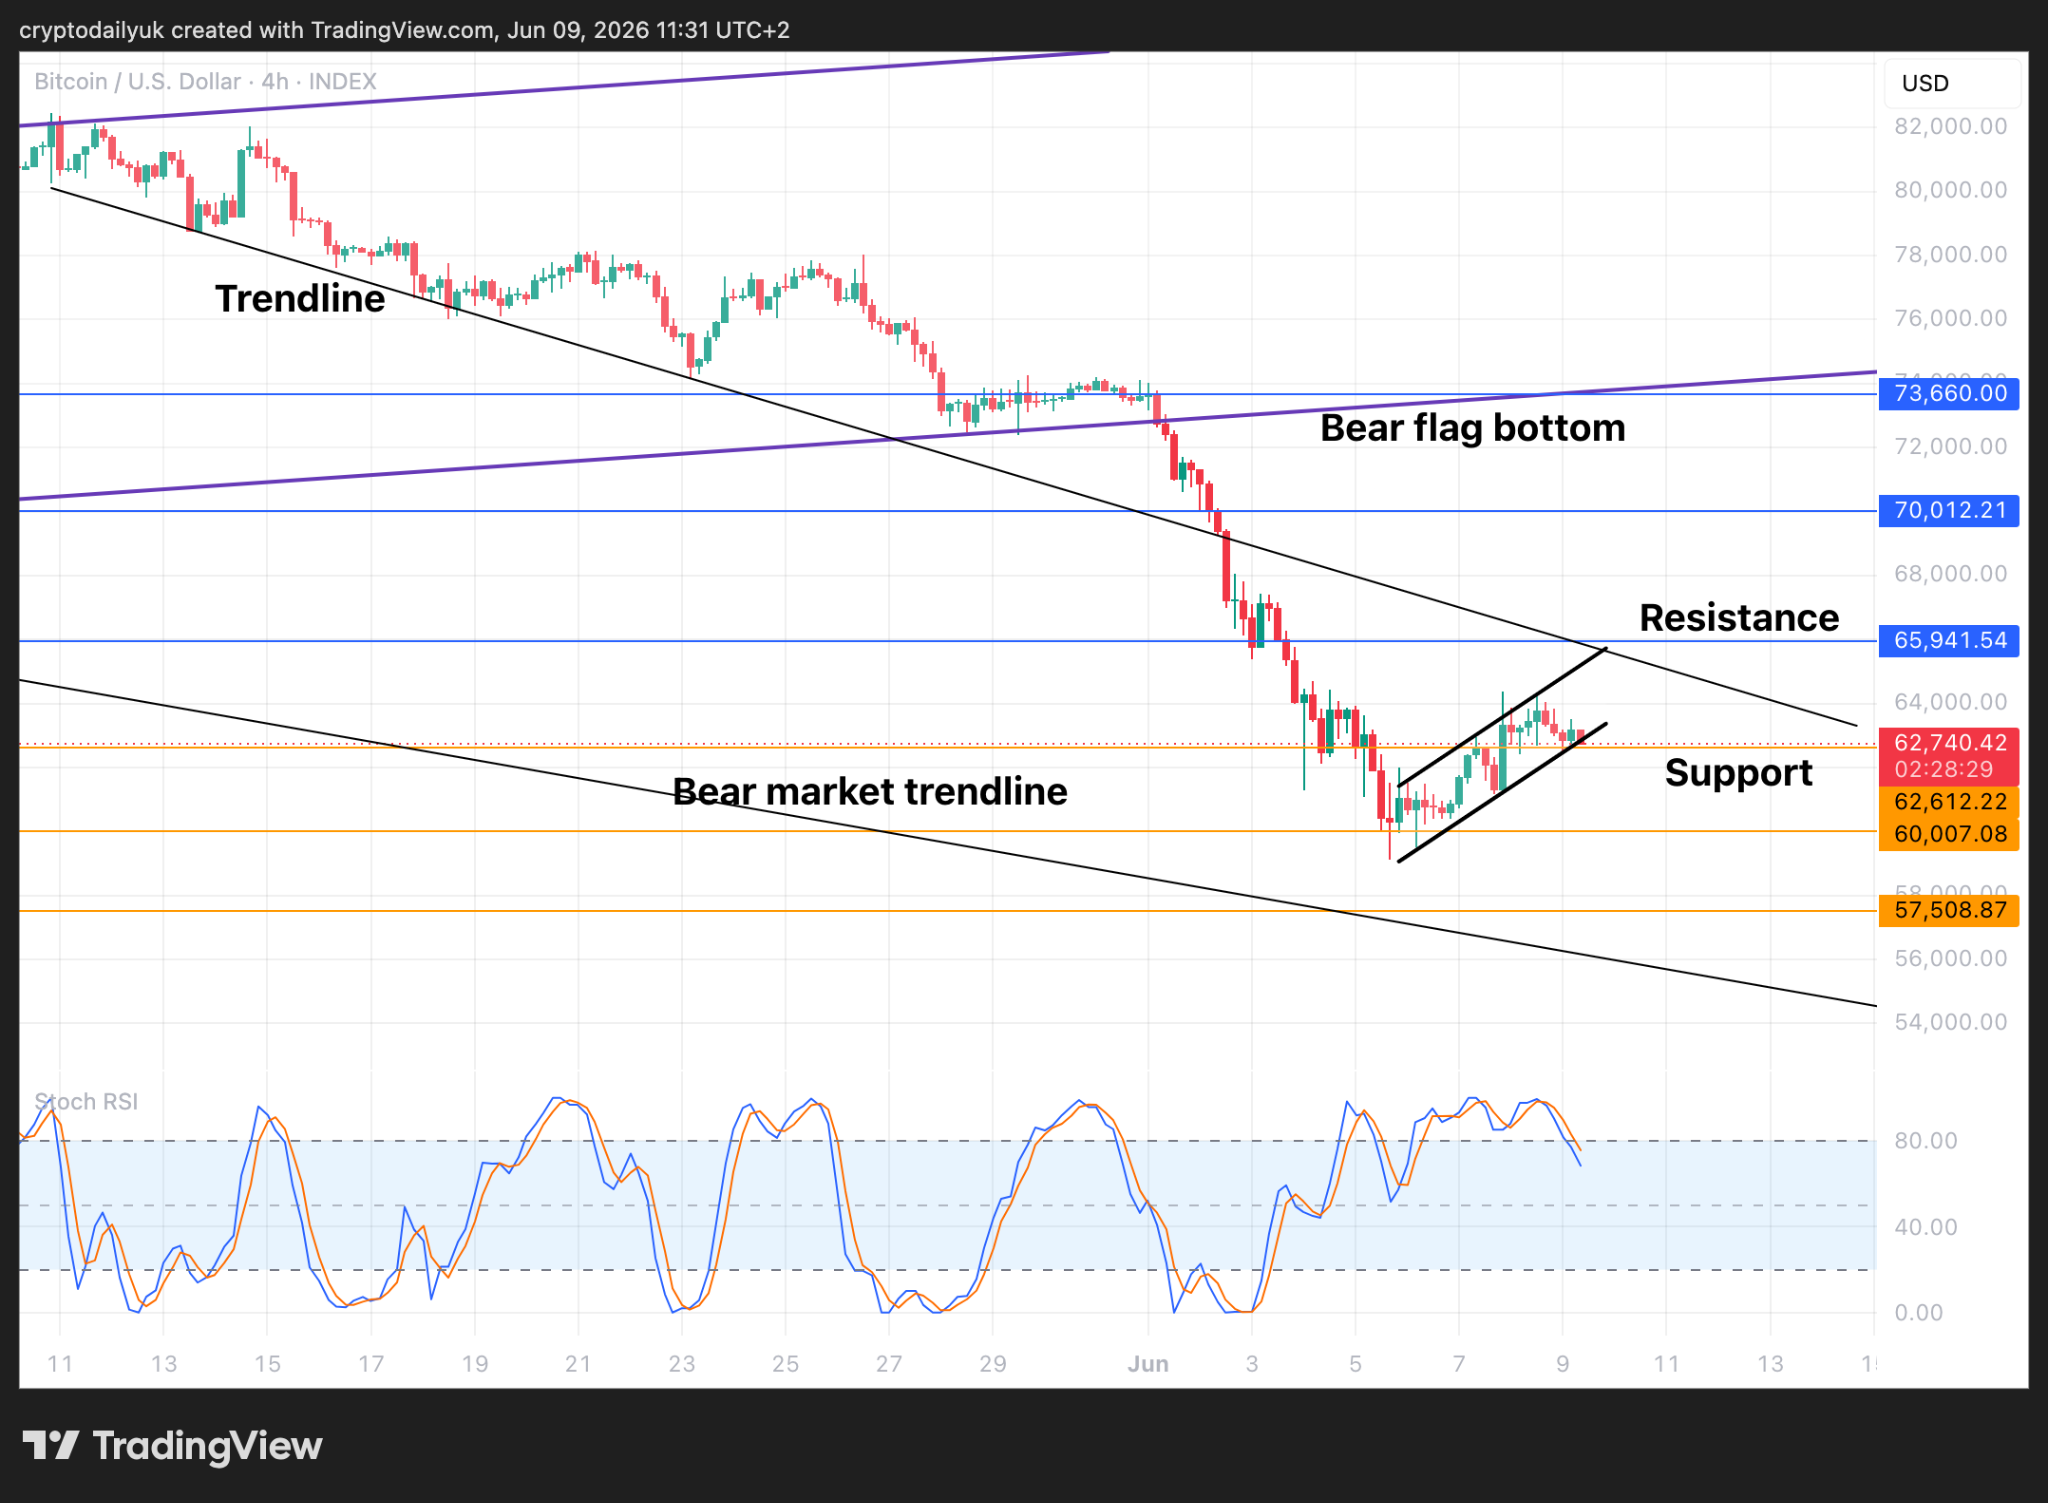
Source: TradingView

The 4-hour chart for $BTC shows us the route of the price action since it fell out of the bottom of the 4-month long bear flag. The path down is quite sharp until the $60K low, which matches up with the foot of the big bear flag and provides the possibility of a double bottom.
From there a bounce occurred and around $5,000 was added to the price during this bullish phase. However, the price action began to form inside a potential bear flag which could be about to break down.
One thing to consider with this bear flag is that it is at rather a sharp angle. Classic bear flags would probably incline to the upside at a more gentle 30 degree angle, whereas this one looks to be a little more than 45 degrees, which is the arguable maximum for a flag.
Be that as it may, the $62,600 horizontal level, together with the bottom of the bear flag, could hold as support and allow the bulls to stage another leg higher to the top of the flag and the descending trendline – possibly confirming it as resistance.
A decent rally still in process?
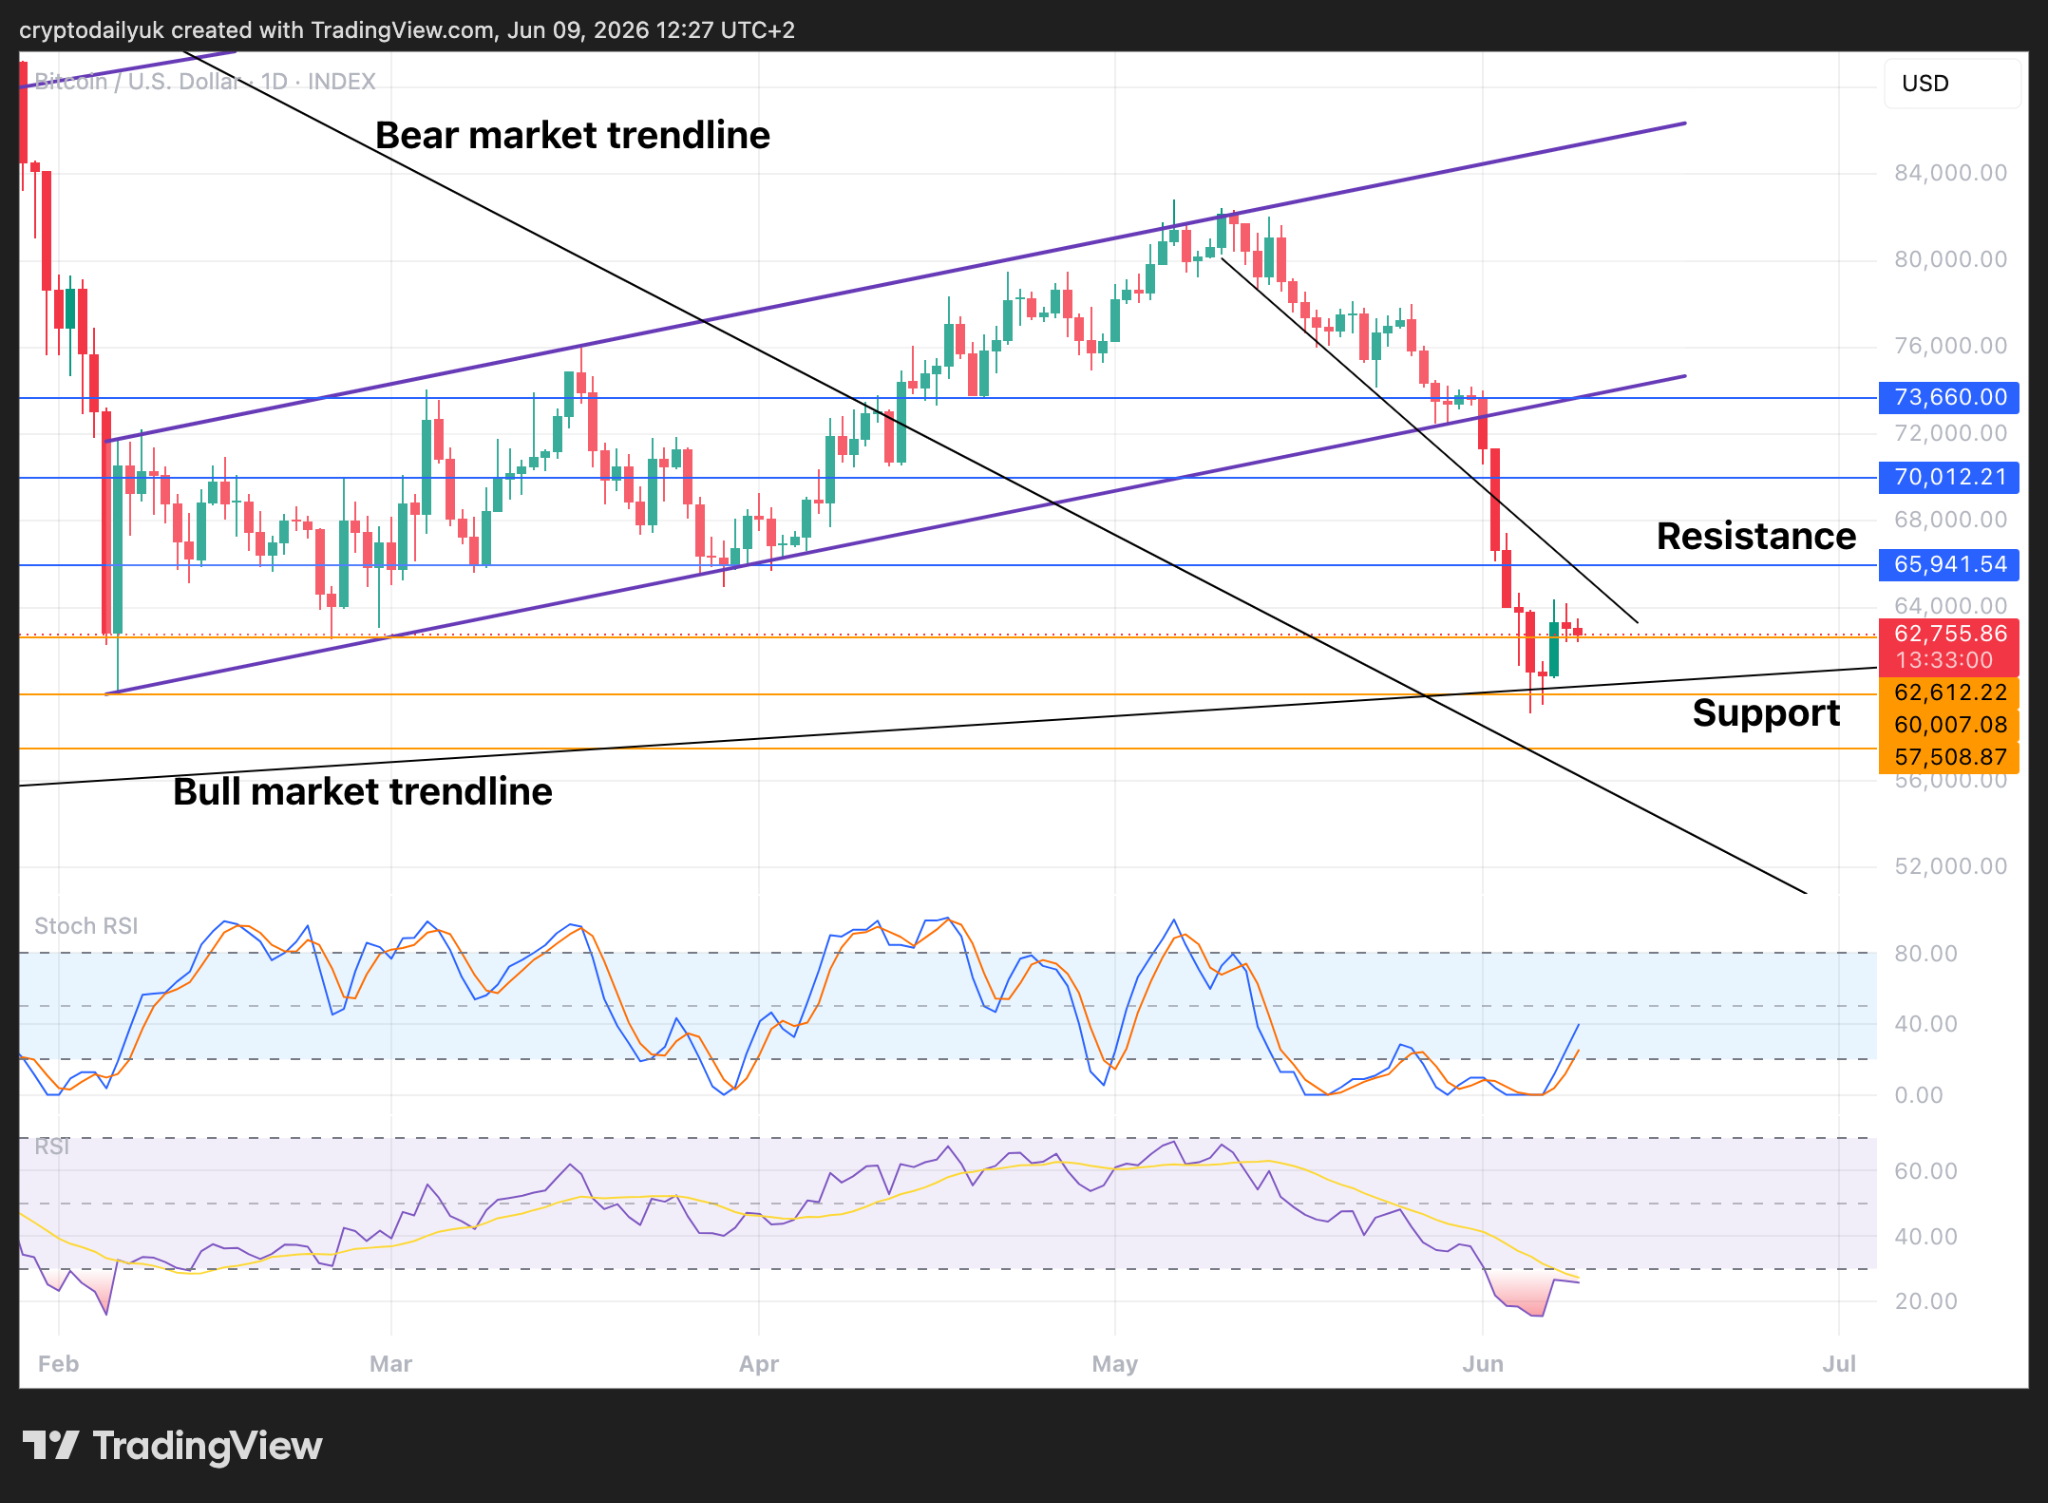
Source: TradingView
If one looks at the price action in the daily time frame without the arguable bear flag, things look reasonably bullish. The $BTC price has held support at the bull market trendline, while the Stochastic RSI indicator lines are moving up through the 20.00 level, and after the Relative Strength Index has seen a huge low. Wouldn’t this at least suggest that a decent rally is beginning?
It certainly could be. That said, the short-term Stochastic RSI indicators are now in overbought territory so we should wait and see where the price is going from here. A retest and confirmation of the bear market trendline could be of huge significance, as this is what brought the 2022 bear market to its end.
Is time still going to be a bear market factor?
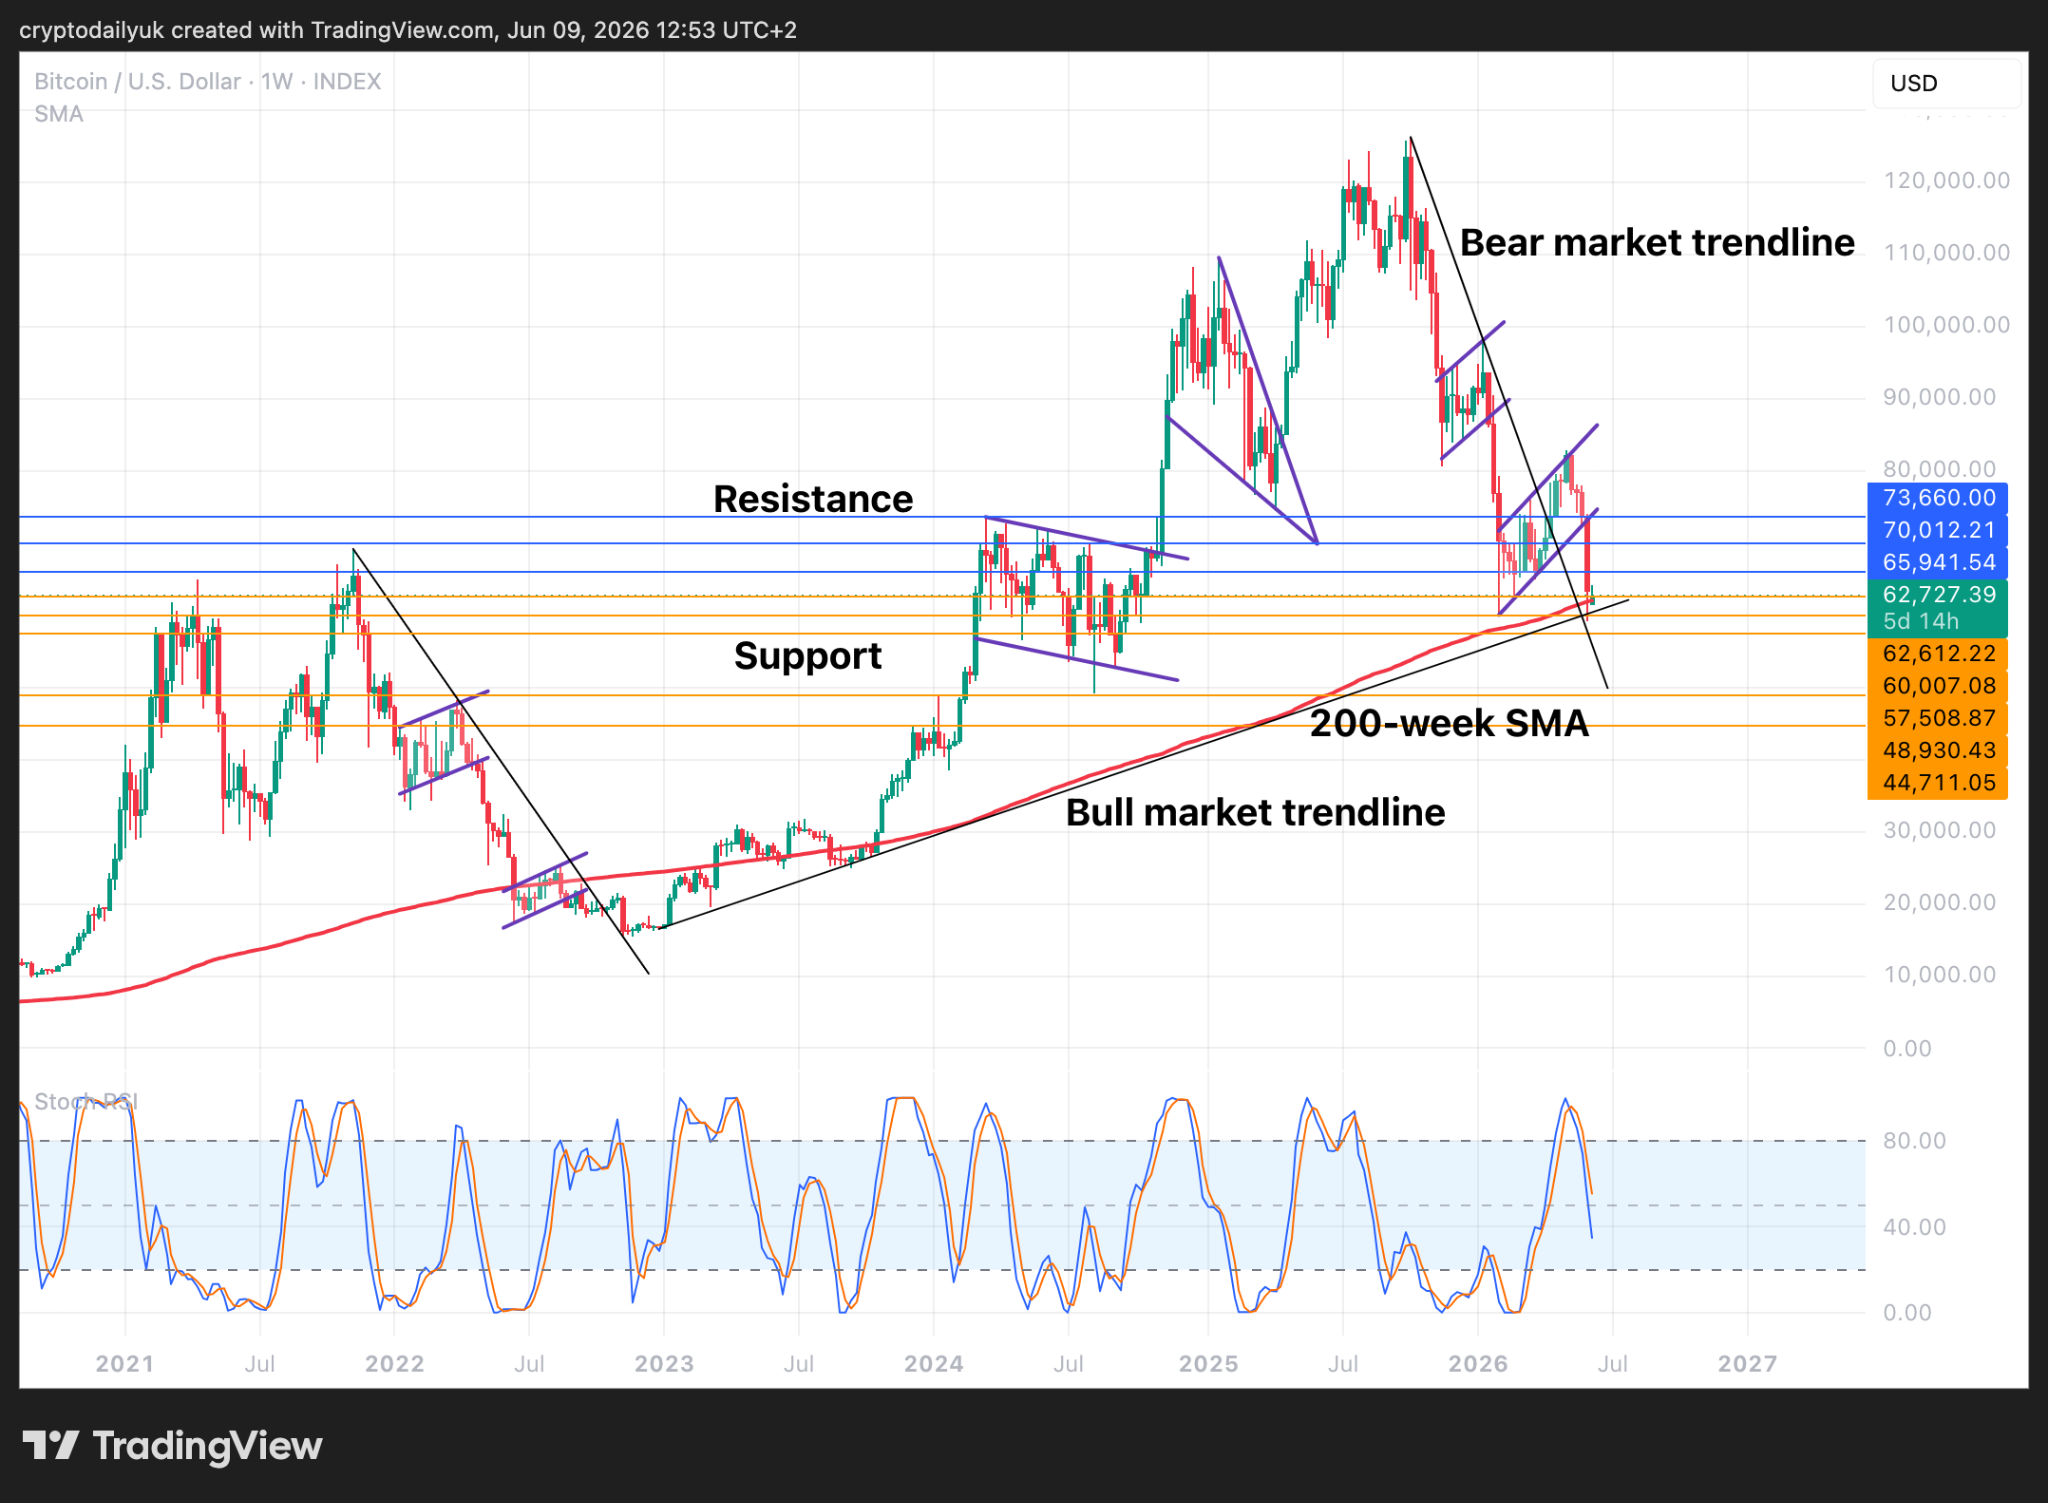
Source: TradingView
The weekly chart remains intriguing. On this much higher time frame it even looks as though the retest of the bear market trendline almost took place. Looking back to the bottom of the 2022 bear market it can be seen how this retest did in fact mark the low point.
However, there is one major difference between what look to be very similar bear markets, and that is time. The 2022 bear market, as well as the one before that, lasted around 52 weeks. This bear market is thus far only out to 35 weeks. If time remains a factor, there are another 17 weeks left in this bear market, which would take us out into October.
One scenario would be for the price to maybe bounce from here, or from that possible retest of the bear market trendline, and then perhaps to come back down for a last flush out in October. This would then help to make a closer fit to the last two bear markets. Other than that, the market will do what it will do and investors and traders will have to react to whatever that brings. History is in the making.
Disclaimer: This article is provided for informational purposes only. It is not offered or intended to be used as legal, tax, investment, financial, or other advice.


Be the first to comment