


What to know:
- Dogecoin (DOGE) is nearing a breakout from a multi-year bullish pennant, a pattern often linked to strong long-term rallies.
- Technical indicators show bearish momentum fading, with MACD signaling that selling pressure may be easing.
- DOGE is consolidating near $0.086, trading within tightening trendlines that support a bullish outlook.

Dogecoin (DOGE) is gaining attention as a long-term bullish pattern approaches a potential breakout after years of consolidation. At the same time, technical indicators suggest bearish momentum is fading for the Dogecoin price, with selling pressure easing and signs emerging that the Dpgecoin price may be entering a stabilization phase.
At the time of writing, DOGE is trading at $0.08631 with a 24-hour trading volume of $465.9 million and a market capitalization of $13.34 billion. Despite the 2.14% loss over the last 24 hours, the DOGE price structure points to an explosive bullish reversal ahead.
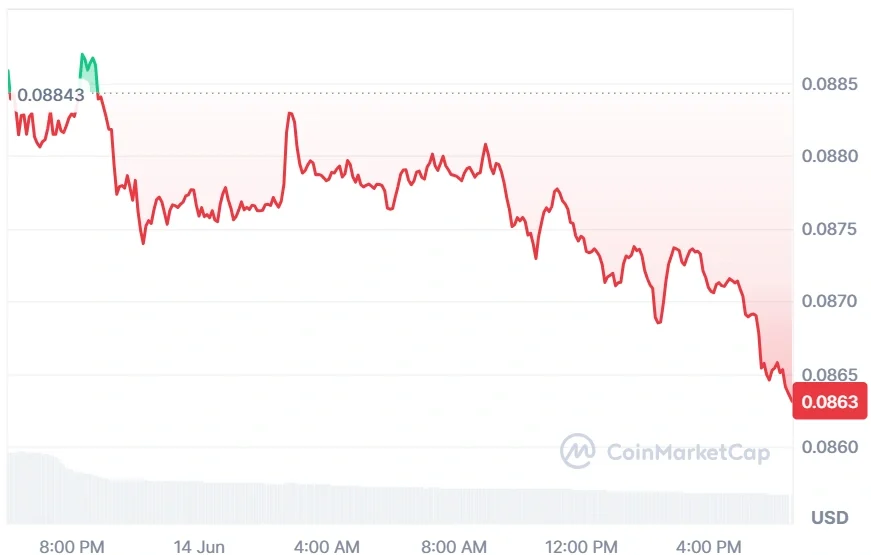

Source: CoinMarketCap

Also Read: Dogecoin Foundation: Strong 200M DOGE Whale Accumulation
Dogecoin price Nears Explosive Breakout on 3-Month Chart
According to the crypto analyst Trader Tardigrade, Dogecoin is attracting renewed attention as its 3-month chart reveals a massive bullish pennant that has been forming for years.
The dogecoin price has continued to trade within tightening trendlines, creating a prolonged period of price compression. Analysts describe the structure as a textbook setup, with each market cycle further strengthening the pattern.

Source: Trader Tardigrade’s X Post
With the Dogecoin price approaching its pattern’s high point, traders continue to track the price movement on their charts in hopes that a breakout might occur, leading to an upswing.
Technical experts believe that this breakout could signal the end of stagnant years ahead. Although some predictions show hope for a $30 target, they are very speculative.
MACD and Bollinger Bands Show Fading Bearish Strength
According to TradingView, the Dogecoin price has shown a significant arc over an extended period of months. While the Dogecoin price saw a strong rally in April until hitting its high point mid-May at about 0.11500, it later fell into a dramatic decline that lasted into early June.
DOGE fell below both its mid moving average and its lower Bollinger Band, although it did stabilize at slightly above 0.08626.

Source: TradingView
The technical indicators indicate a bearish trend, which is moderated by an indication of stabilization. There is increased volatility, as is evident from wide-ranging Bollinger bands where the top line stands at 0.10549 and the bottom at 0.07689.
The MACD indicators remain deep within the negative region but are getting closer together and starting to flatten.
This article contains market analysis and price predictions. These are not guarantees. Crypto markets are volatile. Always DYOR. Not financial advice.
Also Read: Dogecoin Price Eyes Major Rally After Defending Critical 5 Year Support Level

Be the first to comment