


What to know:
- Bittensor (TAO) forms a bullish inverse head and shoulders pattern, signaling a possible reversal and breakout.
- RSI climbs above 60, and MACD confirms a bullish crossover, showing renewed buying pressure.
- A breakout above the neckline could push TAO toward $450–$500, based on measured move projections.

Bittensor (TAO) shows a bullish inverse head and shoulders pattern suggesting a possible reversal after a corrective phase, with traders watching for a breakout that could drive further upside for the Bittensor price. Momentum indicators like RSI and MACD are turning positive, supporting strengthening buying pressure and continued recovery potential.
At the time of writing, TAO is trading at $274.64 with a 24-hour trading volume of $580.58 million and a market capitalization of $3.02 billion. Following the 5.33% gain over the last 24 hours, the TAO price structure and improving technicals point to a bullish reversal ahead.
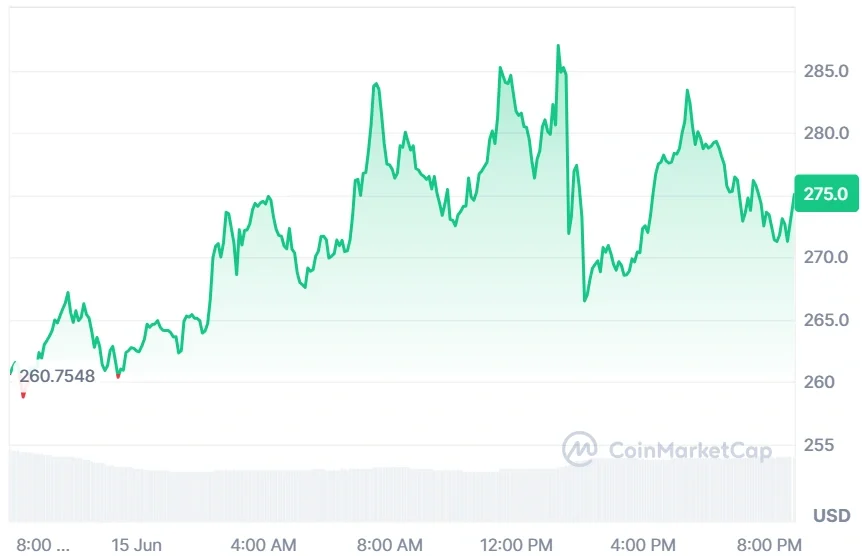

Source: CoinMarketCap

Also Read: Bittensor Price Consolidates as Bulls Target Reclaiming $280 Resistance Zone
Bittensor Price Setup Signals Breakout Toward $500
Furthermore, the crypto analyst Crypto Space revealed that TAO is showing a bullish inverse head and shoulders structure on its chart, with the right shoulder currently forming after a corrective phase.
Traders view this pattern as a potential reversal signal, suggesting that selling pressure may be fading and accumulation is gradually building as market participants position for a possible breakout attempt for the Bittensor price.

Source: Crypto Space’s X Post
In case there is a definitive breakout of the neckline resistance, there is potential for strong momentum to take price levels to the $450-$500 range, according to technical estimates of the height of the chart pattern.
However, the technical analysts point out that the Bittemsor price forecast remains speculative at this time, and in case of a breakdown, consolidation will ensue.
Momentum Indicators Reinforce Upward Recovery
According to TradingView, the Bittensor price shows an impressive bull reversal with remarkable accuracy after a lengthy and painful period of correction.
The Bittensor price rose to the level of $375 during the month of March but has been on a decline from that point onwards, finally finding good support at $185 during the month of June. It is now making a strong comeback by pushing above $270.73.

Source: TradingView
The momentum oscillators confirm the sharp reversal move with great conviction. For instance, the RSI makes a quick recovery from its oversold levels of support to touch 60.13 above its signal line and indicates increased buyer interest in the asset.
On the other hand, the MACD line gives a strong bullish cross above its signal line, and histogram readings increase in green territory.
This article contains market analysis and price predictions. These are not guarantees. Crypto markets are volatile. Always DYOR. Not financial advice.
Also Read: Bittensor Price Prediction: Can Bulls Push It Toward $400–$500 Rally?

Be the first to comment