


What to know:
- Long-term projections place XRP’s potential cycle highs at $3.65, $8.68, $22.50, $59, and eventually $153.
- Technical indicators show weakening bearish momentum as bullish divergence forms on the MACD histogram.
- A breakout from a long descending channel could open the door for a major upside move in the next market cycle.


Market analyst TARA shared a long-term projection for XRP on March 16, outlining how multiple macro cycles could gradually push the asset beyond the $100 mark.
The projection focuses only on price expansion rather than timing, meaning the targets reflect potential levels that could appear over several market cycles.

The focus is on price growth and not on timing, and the targets may be reached over several cycles. Using an XRP/USDT yearly chart on Binance, it tracks long-term growth patterns.
XRP was trading at $1.46 at the start of Cycle 2, based on Fibonacci expansion levels, particularly on the 0.618 ratio. As we can see from the projection, there is a constant rise in peaks. The first part of this model indicates that a top for Cycle 1 exists at approximately $3.65.


Source: X
If this pattern continues, it is expected that the next cycle may take the asset to approximately $8.68. The model then indicates further growth, such as for Cycle 3 at approximately $22.50 and Cycle 4 at approximately $59.
The final part of this model indicates that a top for Cycle 5 may exist at approximately $153, which requires tremendous growth in the market and its value, which is not seen in the current market value of this asset.
Also Read: XRP Tests Key Support as 11% Triangle Pattern Signals Volatility Ahead
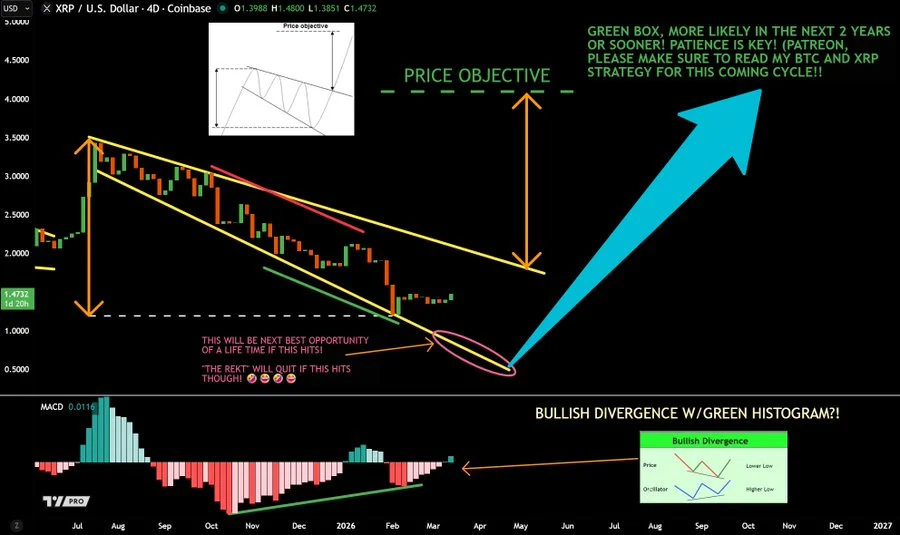
Descending Channel Shows XRP Under Prolonged Pressure
Another technical analysis from JD is based on the short-term price action of XRP. The technical analyst presented a chart showing the price of XRP in relation to the US dollar on Coinbase, with a four-day window.
The price of XRP has been trading in a descending channel with two lines since it peaked at a high of $3.4 to $3.5, with a continuous pattern of lower highs and lower lows.

Source: X
The asset has been moving towards the lower edge of its channel after a sharp fall. From the above analysis, a possible support area has been identified between $1.10 and $0.50, where buyers might begin accumulating positions.
From a technical standpoint, long-term downtrends in falling channels are areas where a price usually consolidates before a bigger move. In this case, if a price consolidates in this area, it could be a sign that this pattern is completing the last part of the downtrend.
Momentum Signals Point to Possible Reversal Setup
While prices are falling, technical indicators of momentum show that selling pressure may be abating. The MACD histogram is starting to create higher lows, yet the price continues to create lower lows.
This phenomenon is known as bullish divergence, which is a technical analysis term for diminishing bearish momentum. It implies that buyers are gradually entering the market, in spite of falling prices.
Another signal is that the histogram bars are moving to positive territory. When the bars change from red to green, it could be a signal that the price is improving, which could be a precursor to a larger price movement up.
If XRP manages to go past the falling resistance line, the measured move from the chart could be similar to a previous price movement that went from $1 to more than $3.5.
This article contains market analysis and price predictions. These are not guarantees. Crypto markets are volatile. Always DYOR. Not financial advice.
Also Read: XRP Crashes Below Realized Price As Bears Take Control

Be the first to comment