


What to know:
- Solana rebounds above $95, showing strong recovery signals after a major market dip.
- Technical indicators like RSI and MACD suggest cautious optimism and potential upward momentum.
- Long-term targets remain between $500–$1,000, with key support and resistance levels closely watched.


Solana is showing signs of recovering from a major market dip, attracting investor attention. Recently, there was a call to take profit at higher levels, helping early investors avoid huge losses. Analysts have suggested that the best time to take advantage of the market is when there is fear, which often indicates a future rally.
At the time of writing, Solana is trading at $95.46, with a 24-hour trading volume of $7.87 billion and a market capitalization of $54.32 billion. Solana’s price is up by 1.09% over the last 24 hours, indicating a strong recovery.


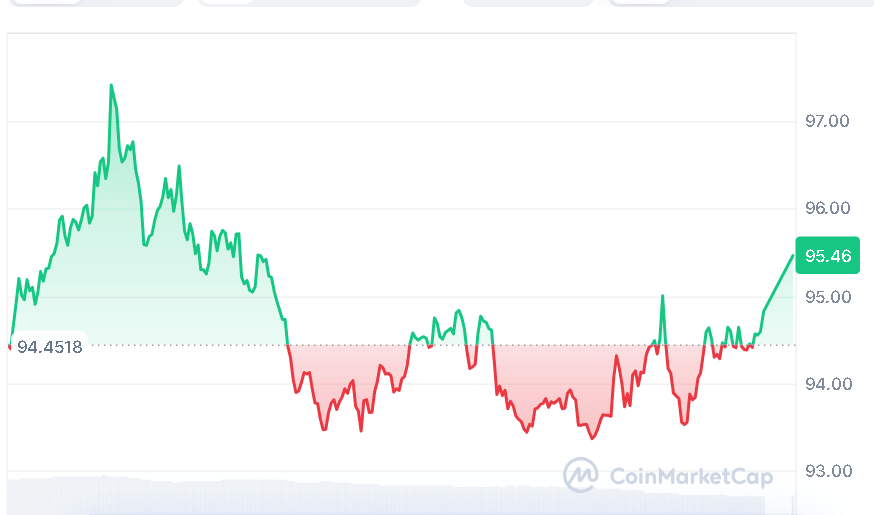
Source: CoinMarketCap
Solana Investors Learn Key Strategy
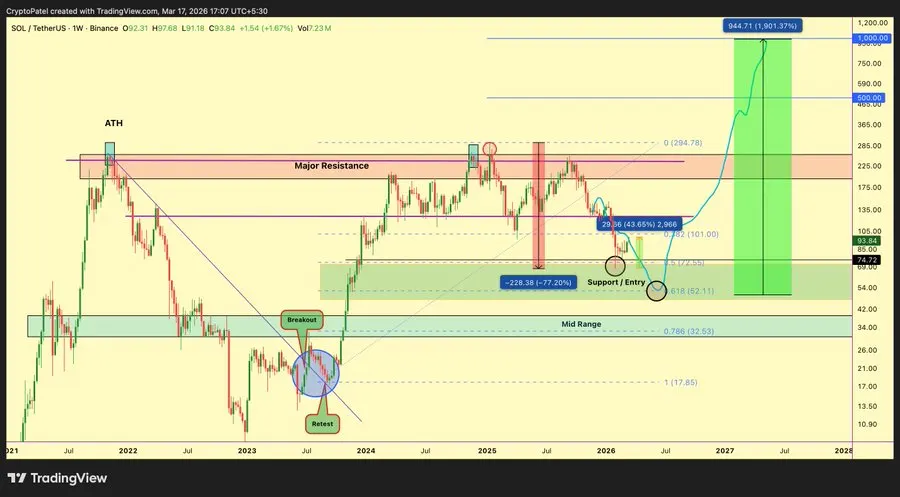
Crypto analyst Crypto Patel shared an important lesson for investors: Selling Solana near $250 saved many from a 73% loss. Patel explained that while this market has been extremely euphoric, taking profits in the $200 to $250 range has been a good idea.

Source: X
As anticipated, SOL eventually dipped by almost 77%, trading at $67 after being at $295. The price has since risen significantly after the retracement at the 0.50 Fibonacci level and is trading above $90, an increase of about 45% from the suggested entry point by Patel.
Patel explained that in case SOL goes below $72, he is going to buy it aggressively at prices below $50, as this is his ideal buying zone. Patel’s long-term target is between $500 and $1,000.
Patel advised investors to take profits during euphoric markets and to take advantage of the market during a panic sell-off.
Also Read | Chainlink Maintains Momentum Above $9.50, Eyes Higher Resistance Levels
SOL Technicals Suggest Uptrend Ahead
Solana’s technical indicators reflect cautious optimism. The RSI is at 59.84, above the signal line at 50.29. This is a bullish signal. SOL is above the short-term MAs of $87.12 and $89.77, thus supported. The long-term MAs of $110.46 and $148.39 are resistance.

Source: TradingView
MACD is now positive, with the main line at 0.745, above the signal line, while the histogram is at +1.708. This is a sign of increasing buying pressure, though the negative reading of -0.963 indicates that the upward trend is not fully confirmed.
However, as the price rises for Solana, investors are also focusing on the resistance levels and potential buying areas at lower levels. The coming days will be important in determining whether the asset will continue its uptrend towards higher targets.
This article contains market analysis and price predictions. These are not guarantees. Crypto markets are volatile. Always DYOR. Not financial advice.
Also Read | Dogecoin Tests Key Resistance as Breakout Targets $0.151 Amid Bitcoin Volatility

Be the first to comment