


What to know:
- Fetch.ai (FET) price breaks $0.20 resistance, signaling strong bullish momentum ahead.
- Next FET resistance is seen near $0.85 after a confirmed breakout on higher timeframe charts.
- RSI shows overbought conditions, but MACD keeps the overall bullish trend intact.


Fetch.ai (FET) is moving in a neutral setup after a prolonged downward phase in the crypto market. The FET price has stability over the last 24 hours, but it has surged by 58.2% over the last week.
According to CoinMarketCap, FET is trading at $0.2397, with a trading volume of $200.46 million, down by 44.52% over the last 24 hours. Furthermore, its market capitalization stands at $541.84 billion, which is also stable.


Source: CoinMarketCap
Also Read: FET Tests $0.15 Resistance, Breakout Could Trigger 50% Rally
FET Price Breakout Sparks Bullish Rally Toward $0.85
Fetch.ai (FET) is also gaining attention as it re-established the major high timeframe resistance level around the price of $0.20, a level that previously controlled the price for a few months.
Crypto analyst Crypto Feras claims that as the price holds above this level, it is a clear indicator of a change in the structure of the trend, where resistance turns into support.
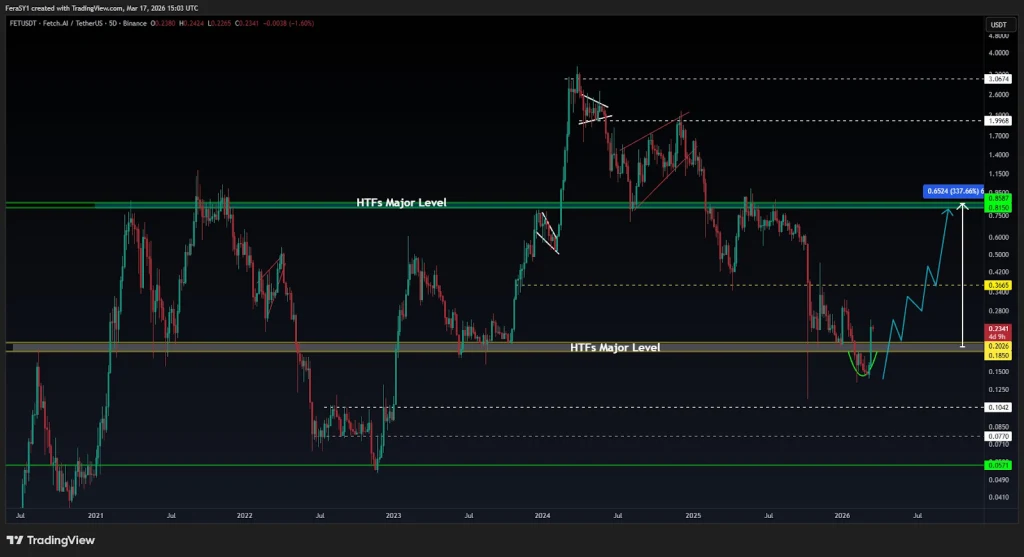
Source: Crypto Feras’ X Post
Now, the breakout has been established; technical indicators suggest that the next significant resistance level will be around $0.85. If this trend is sustained, it will be a near four-fold jump from the breakout zone itself.
There is renewed interest in AI-based cryptocurrencies, and Fetch.ai is one such cryptocurrency that traders are hoping will start a sustained move higher.
FET Technical Outlook Supports The Recovery Phase
According to TradingView, FET shows a definitive bullish breakout with a steady accumulation pattern. Price action has moved well past the 1.618 Fib level at $0.222 and is now heading for the 2.618 extension at $0.273. With the DEMA 9 acting as dynamic support at $0.220, the trend looks healthy despite the vertical move.
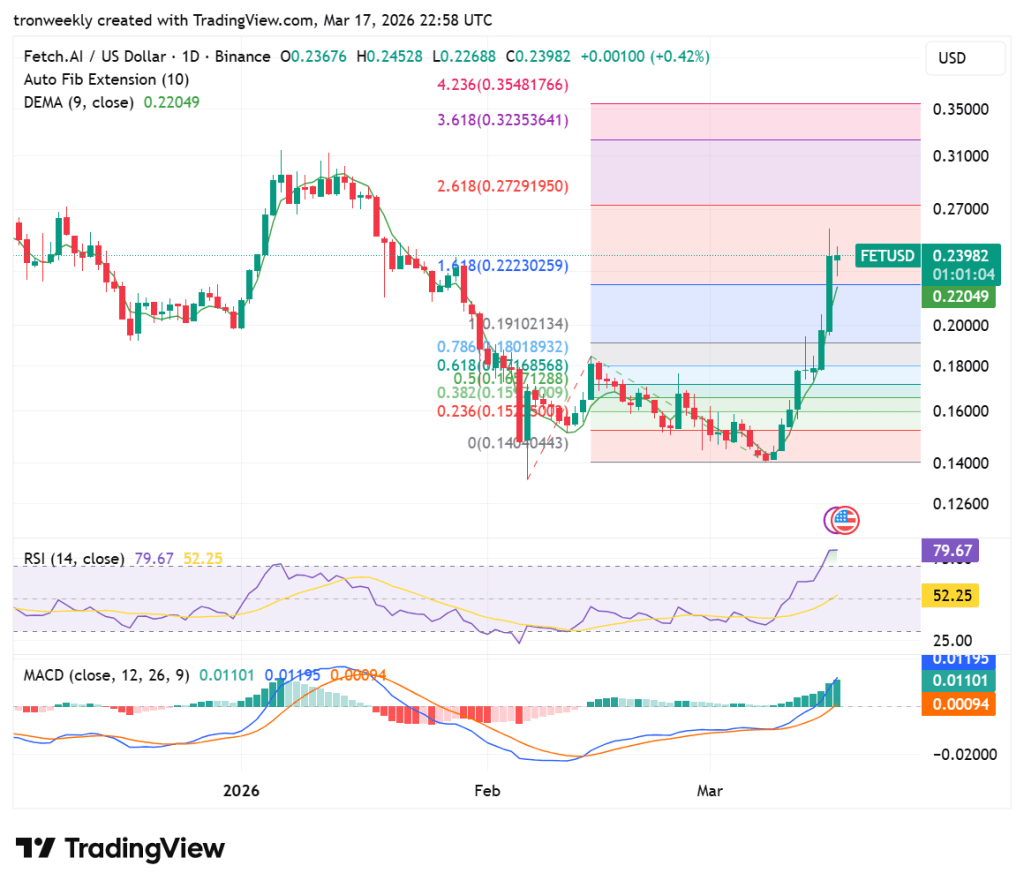
Source: TradingView
Momentum indicators also support this by showing that the market is overbought. The RSI is at 79.67, which may indicate a period of cooling off.
However, the MACD indicator is showing a series of expanding histograms, with a large divergence existing between the MACD and signal lines. Traders may be looking for a successful re-test of resistance levels as a new level of support.
This article contains market analysis and price predictions. These are not guarantees. Crypto markets are volatile. Always DYOR. Not financial advice.
Also Read: FET Rally Gains Strength as Volume Jumps 93% and Bulls Target $0.45

Be the first to comment