


What to know:
- XMR price stays under pressure as traders watch weak momentum and key support levels.
- Analysts flag double bottom and falling wedge signals as XMR holds key retest zones.
- CoinGlass data shows higher futures volume, lower open interest, and slightly positive funding.

The XMR price stayed under pressure on Wednesday, June 25, 2026, as Monero traders tracked weak momentum across the market session. Analysts also pointed to breakout signals, derivatives activity, and key technical levels.
Monero (XMR) is trading at $302.52, showing a decline of 5.76% in a day. The trading volume has gone up by 5.37% and is currently standing at $135.44 million. Over the last week, the coin price has decreased by 8.05%, according to CoinMarketCap.
Also Read: ICP Price Analysis: Falling Wedge Pattern Signals Reversal Toward $2.60

XMR Price Setup Points to Possible Bullish Breakout
Crypto analyst Gopal highlighted that XMR is forming a potential double bottom within a clear rectangle pattern. The buyers are defending the lower range with multiple tests of support.
He said the bounce from the second bottom gives an indication that momentum is gaining. The move also points to possible accumulation while XMR stays inside the range.
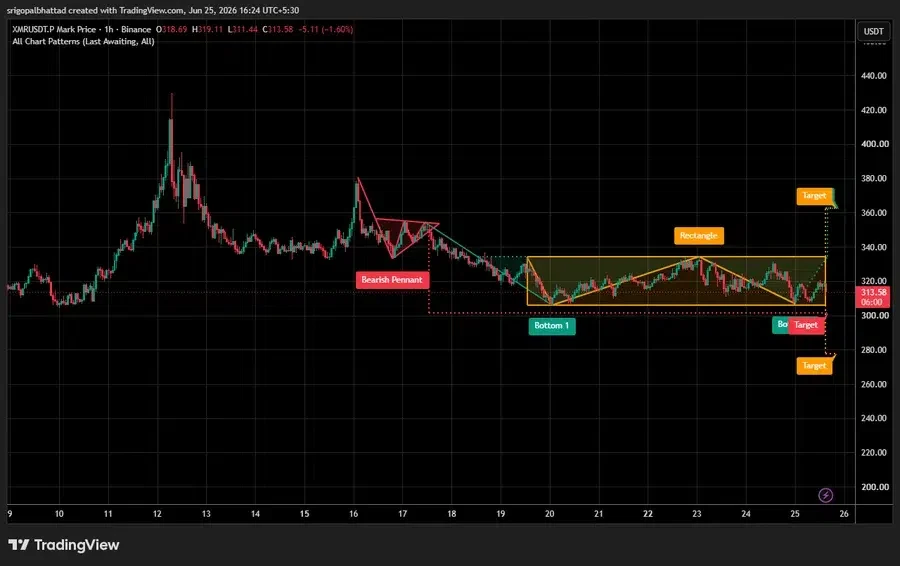

The analyst added that a breakout beyond the rectangle resistance level would validate the bullish intention. This could spur a more robust expansion if buyers continue to gain control.
In addition, another analyst, Alpha Crypto Signal, mentioned that XMR has broken out from a falling wedge. The token is now holding the retest zone, which suggests sellers have lost some control.
The analyst noted that buyers are stepping in at higher lows. This indicates that bear momentum is losing strength, and market structure is beginning to strengthen.


According to Alpha Crypto Signal, XMR could move higher if the retest of support remains intact. A sustained move above recent highs could validate bullish continuation and pave the way for a more powerful rally.
Derivatives Data Signals Cautious Market Activity
CoinGlass data shows that the future volume increased by 6.90% to $113.78 million. Open interest dropped 4.35% to $145.29 million, indicating some traders were reducing or closing positions. The XMR OI-weighted funding rate is at 0.0103%, indicating that funding is slightly positive.
XMR EMA and Bollinger Bands Signal Weak Momentum
From a technical perspective, short-term Exponential Moving Average (EMA) data showed resistance above the current price. The 20-day EMA stands at $329.84, while the 50-day EMA is at $347.60. The XMR price trades below both levels.
Longer-term EMA data also shows overhead pressure. The 100-day EMA stands at $358.42, while the 200-day EMA is at $362.42. These levels are still higher than the current price on the daily chart.
The Bollinger Bands (BB) data shows the middle band is at $327.22. The upper and lower bands are set at $285.00 and $369.44, respectively. The XMR price hovered near the lower band.
This article contains market analysis and price predictions. These are not guarantees. Crypto markets are volatile. Always DYOR. Not financial advice.
Also Read: SEI Price Prediction: Can Bullish Momentum Drive a $0.13767 Move?
Be the first to comment