


What to know:
- XRP rebounds toward $1.50 but remains below key resistance and major moving averages.
- Ascending triangle suggests breakout potential, yet $1.75–$1.80 resistance caps the upside.
- Volume and open interest drop as the market awaits a clear move above critical resistance levels.

XRP is attempting to recover after rebounding from recent lows, but overall, the trend remains weak. The cryptocurrency has stronger momentum in the short term but is still trading below significant resistance points and moving averages.
The token has moved towards the $1.50 psychological level after holding above the $1.10–$1.20 support zone. This support level has been responsible for ensuring stability in the prices in the past few trading sessions.

XRP RSI Strengthens as Trend Remains Weak
The momentum indicators also indicate an improvement in this recovery phase. The Relative Strength Index (RSI) is increasing, which is a positive indicator of strong momentum. However, the price is trading below a falling trend line.
Additionally, XRP is trading below the 100-day and 200-day moving averages, which is an indicator of the overall bearish trend. The next key area of resistance, which the buyers need to clear, is between the $1.75 and $1.80 range.

Source: TradingView
A move above this resistance level could change the short-term trend if successful. The next key target, if the buyers are successful in breaking above the current resistance, is between the $2.40 and $2.50 range. The XRP needs to close above the 200-day moving average, which is around the $2.10 level.
Until the levels are cleared, the current price action can be considered a relief bounce. The trend is still not confirming the reversal. However, holding above the support zone of $1.10 to $1.20 keeps the buyers engaged in the market.
Also Read: XRP Mirrors 2017 Setup As Explosive Cycle Signal Emerges
XRP Triangle Highlights Critical Levels
Egrag Crypto, an analyst, pointed out the formation of the ascending triangle pattern. This triangle formation is taking place below the resistance zone of $1.65 to $1.70, known as Zone 1.
The analyst indicated that this kind of formation is likely to be a signal of a potential breakout. The formation likely offers a 65% chance of breaking the price above Zone 1. There is also a 35% chance of rejection or false breakout.

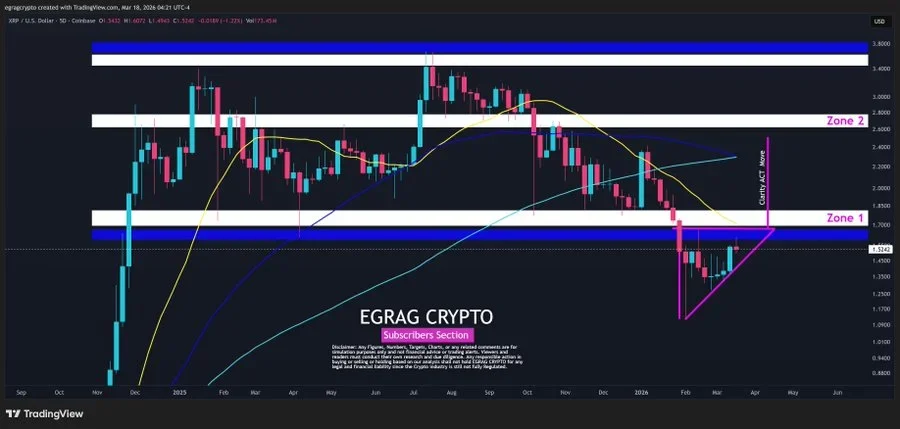
Source: X
The analysis also points to the role of external catalysts. Regulatory actions such as the Clarity Act may affect price direction. If there is a delay in such actions, there is a risk of rejection at resistance levels.
For a move beyond Zone 1, further confirmation is required. A move towards Zone 2, which is above $2.60, will require stronger support. This includes price closes between $1.85 and $2.00.
Volume and Open Interest and Decline
According to CoinGlass data, the volume decreased by 34.87% to $4.79 billion. The open interest also declined by 2.88% to $2.77 billion. The OI-weighted funding rate is at 0.0029%. This reflects balanced positioning in the derivatives market.

Source: CoinGlass
XRP is still at a critical point in its structure. The short-term signals are improving, but resistance levels remain in place. The next move will be determined by whether XRP can clear these levels.
This article contains market analysis and price predictions. These are not guarantees. Crypto markets are volatile. Always DYOR. Not financial advice.
Also Read: Bittensor (TAO) Break Above $300 Could Unlock a Rally Toward $2000-$3000

Be the first to comment