


Bears remain in control of the cryptocurrency market, pushing Bitcoin even lower than before. One of the most crucial psychological support areas has come back into focus as Bitcoin has resumed its downward trajectory after failing to maintain its recovery attempt in May. It is currently trading just below the $60,000 level.
Technically speaking, the future is still uncertain. While the larger trend continues to produce lower highs and lower lows, Bitcoin is trading below its short-term and medium-term moving averages. Aggressive selling pressure has been applied to recent attempts to regain momentum, indicating that buyers are still reluctant to intervene at current levels.
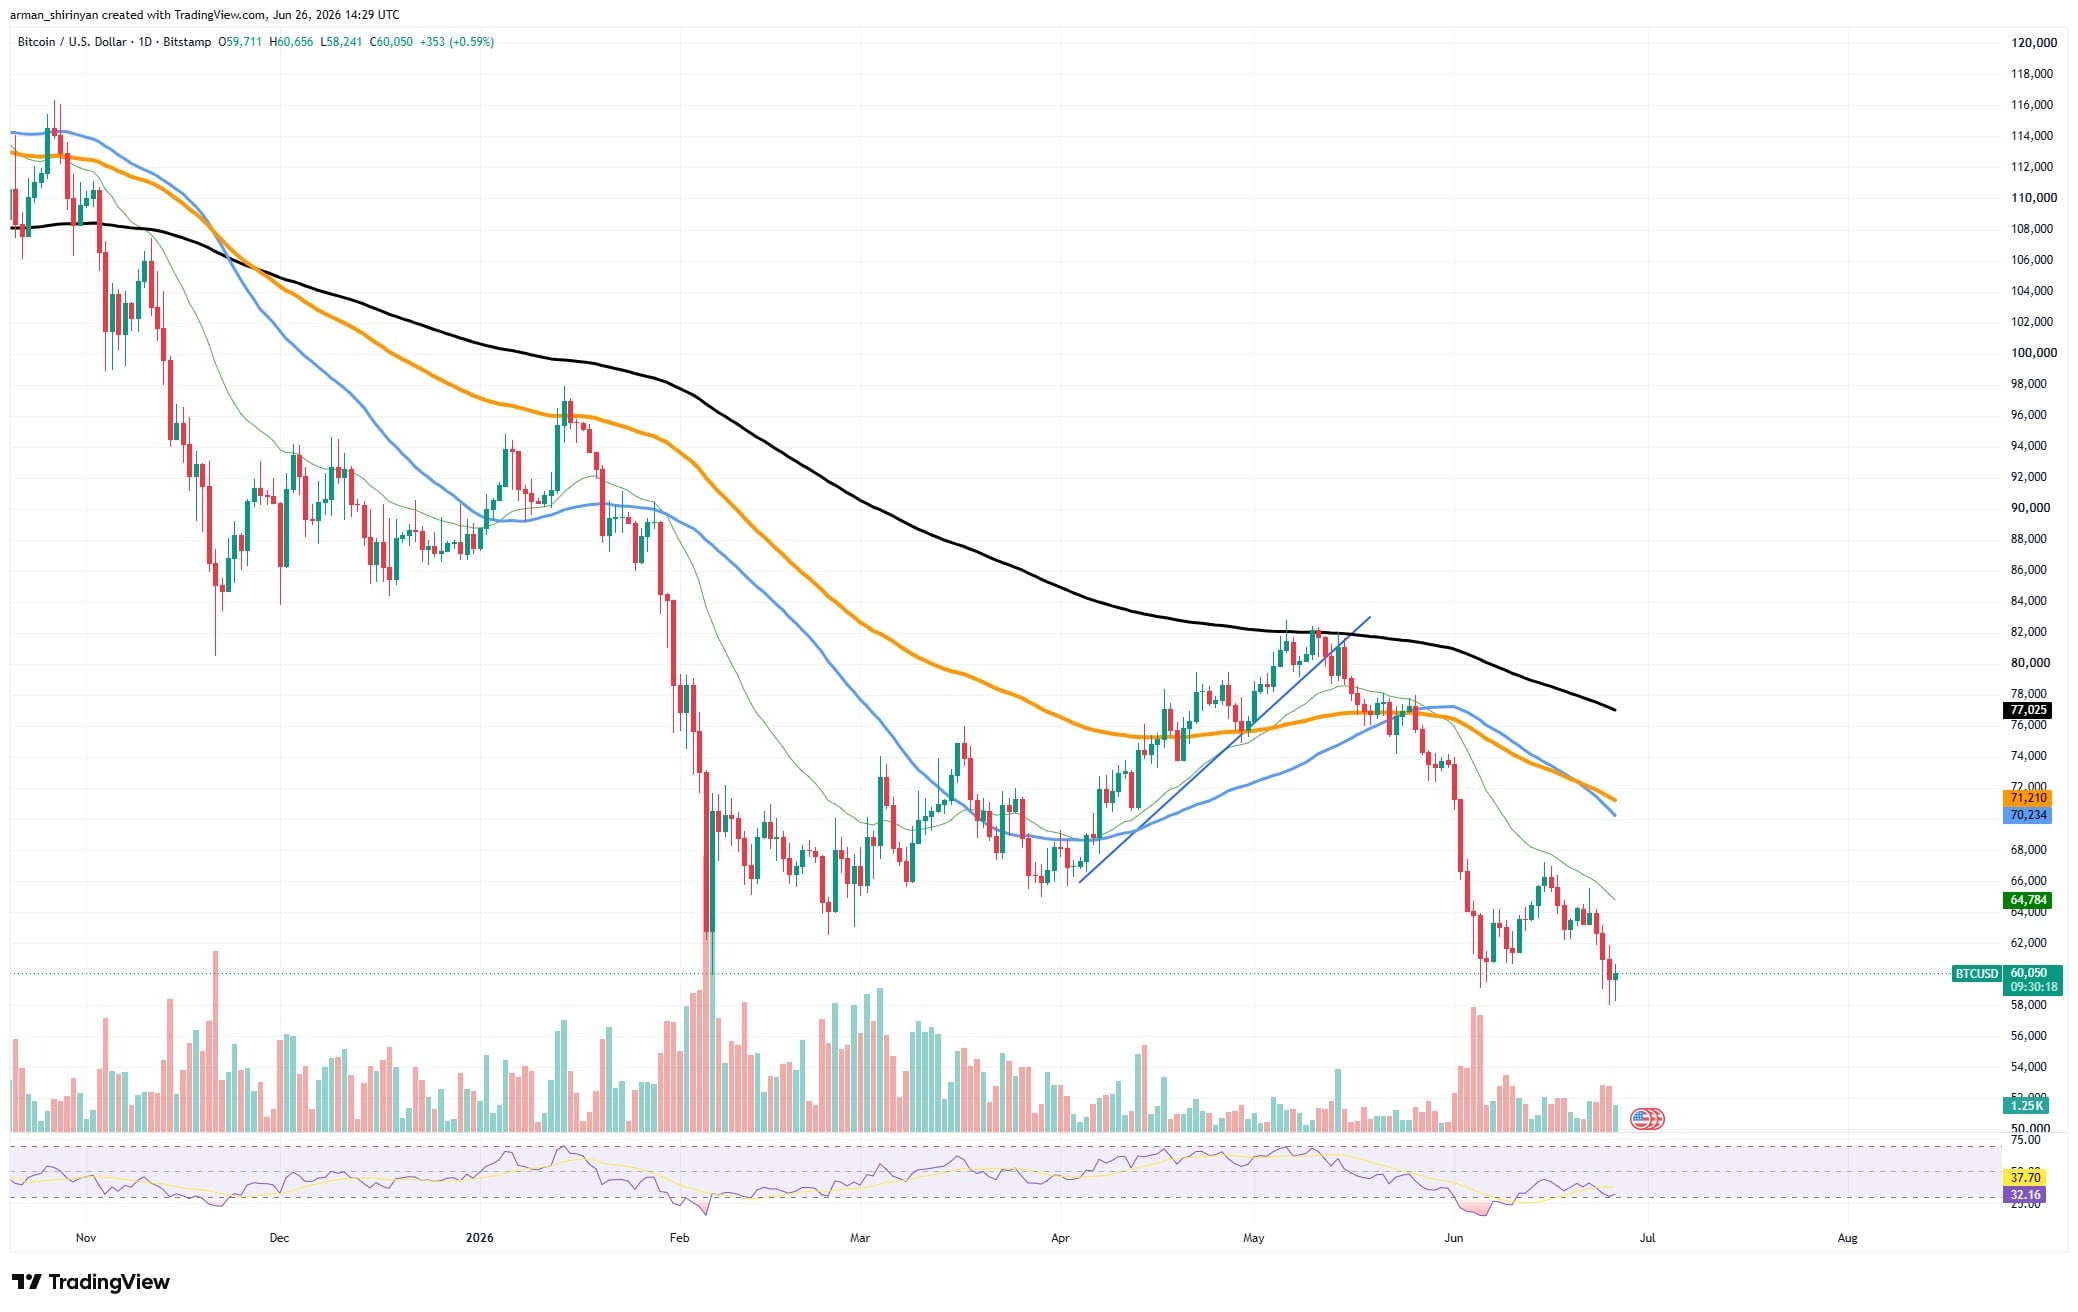
The $60,000 mark is especially important because it was a key support zone and a consolidation area in earlier market phases. Bulls and bears frequently engage in intense market reactions around these levels, which makes them ideal battlegrounds. The current chart suggests that it is possible for Bitcoin to return to $60,000, and it might do so sooner rather than later.

There is little indication that a lasting bottom has formed because price action has already dropped into the low-$60,000 range and the bearish structure is still in place. It is impossible to rule out a move towards $60,000 or even a brief breakdown below it if sellers keep control.
You Might Also Like

Reaching $60,000 does not, however, guarantee that the market will keep collapsing. In the past, significant psychological levels have frequently generated new demand, particularly when sentiment turns overly negative. Additionally, the Relative Strength Index is getting close to oversold territory, indicating that the downward momentum may be stretching in the near term.
Not whether Bitcoin can return to $60,000, but whether buyers will support it, is the crucial question. A robust response from that region could lay the groundwork for a recovery. On the other hand, if the level is not maintained, Bitcoin may experience a more severe correction and market sentiment may become even more pessimistic.
XRP at the critical threshold
As XRP continues to decline toward $1, it is getting close to one of the most significant psychological levels in its recent market history. Bulls have less and less room to regain control as selling pressure has increased since the market broke below a multi-month support zone in early June.
Technically speaking, the situation is still difficult. After several months of developing a descending triangle pattern, XRP recently completed a bearish breakdown. A wave of selling that drove the asset toward new local lows and confirmed the wider bearish trend was sparked by the loss of support around the $1.30 area. As of right now, XRP is trading below all significant moving averages on the chart.
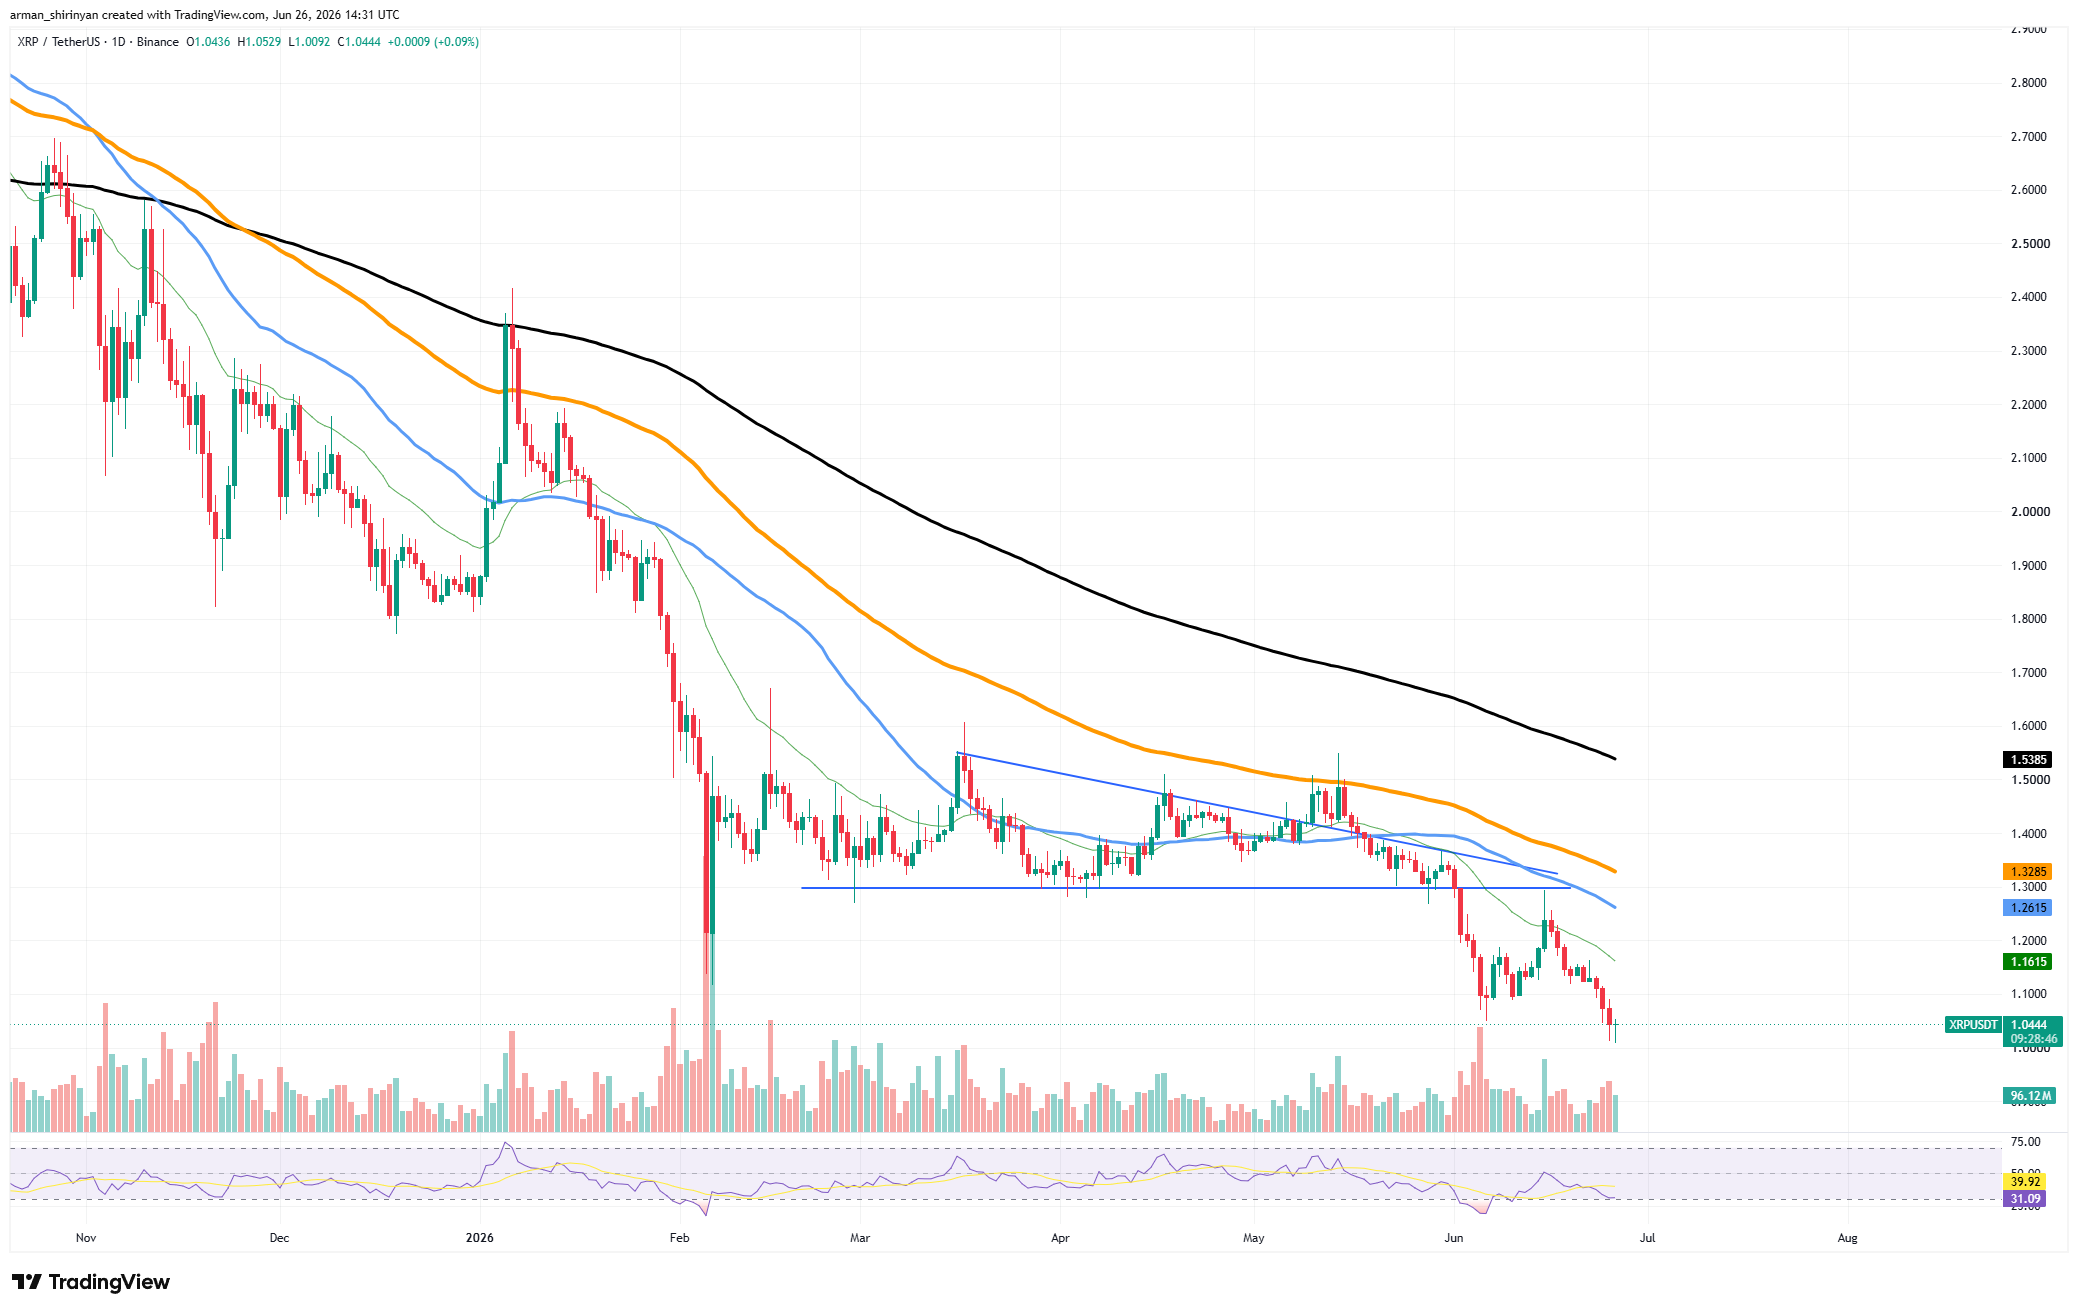
There are several layers of resistance because the 20-day, 50-day, 100-day, and 200-day trend indicators are all above the current price. This alignment usually indicates a market in which sellers are in control over both short-term and long-term periods. As of right now, the next significant support level is the $1 level.
You Might Also Like

Because traders see psychological round numbers as natural valuation zones, they frequently draw significant buying interest. However, every time bearish momentum increases, support levels weaken. Technical and psychological repercussions would probably result from a break below $1. From the standpoint of a chart, it would signify the disappearance of a significant threshold that has traditionally drawn demand. As traders reevaluate their expectations for the asset, such a move might trigger more stop-loss orders and raise volatility.
Oversold conditions are starting to appear at the same time. The Relative Strength Index has shifted to lower levels, suggesting that short-term selling pressure may be getting stretched. This raises the likelihood of brief relief rallies if buyers choose to defend important support zones, even though it does not ensure a reversal.
Shiba Inu hits resistance
Although Shiba Inu is still trapped in a wider decline, recent price movement indicates that the bearish momentum may be waning. Even though SHIB is still trading close to yearly lows and below significant resistance levels, a number of technical indicators suggest that sellers may not have complete control over the market. Momentum indicators are the most obvious source of information.
A bullish divergence has resulted from SHIB’s Relative Strength Index failing to reach corresponding lows despite new local lows being recorded. Even if the asset has not yet begun a significant recovery, this pattern frequently emerges when selling pressure starts to lessen. Additionally, price action provides an intriguing narrative. SHIB formed a small descending wedge pattern throughout June, which is usually linked to slowing downward momentum.
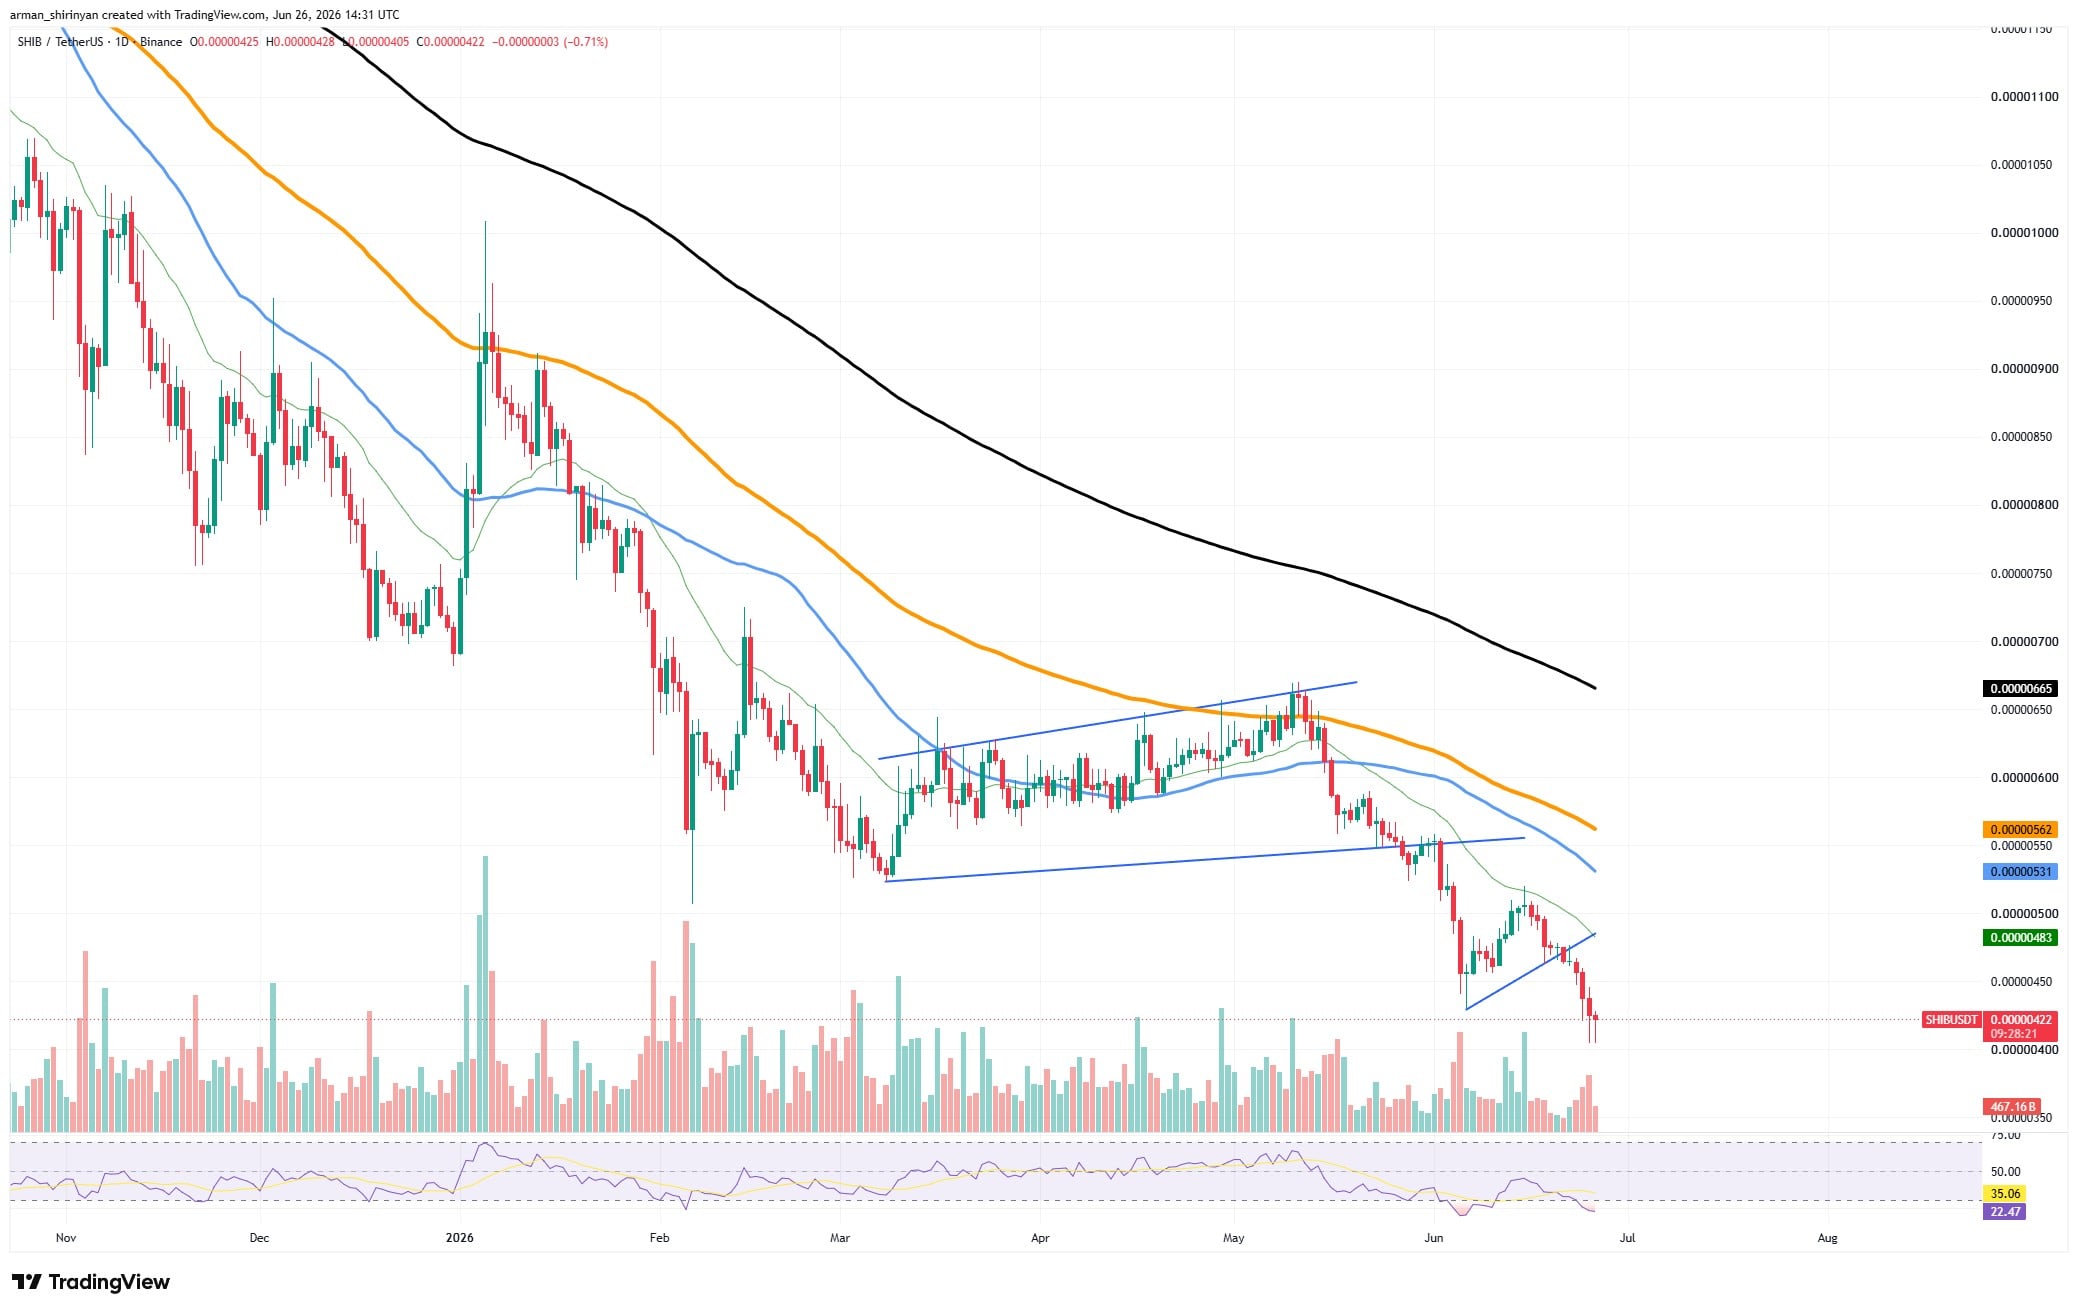
Even though the asset broke lower in the end, the subsequent decline lacked the violent volume spikes that marked earlier selloffs this year. This implies that there may be a shortage of highly motivated sellers in the market. Positioning in relation to moving averages is another crucial element. SHIB is still below its 20-, 50-, 100-, and 200-day moving averages, indicating that the overall trend is still negative.
The difference between the price and shorter-term moving averages, however, has begun to narrow. In the past, significant trend reversals frequently start with a decline in bearish momentum long before the price actually breaks above resistance. However, waning bearish pressure should not be mistaken for a confirmed bullish reversal.
No significant resistance zones have been reclaimed by buyers, and the market structure still exhibits lower highs and lower lows. The larger downtrend continues until SHIB is able to break above its declining short-term trendline and create a higher low. Instead, the current configuration suggests a phase of transition.
Although bears continue to dominate the chart, their impact seems to be less significant than it was during the steep drops observed earlier this year. SHIB may be more susceptible to a relief rally if the overall state of the cryptocurrency market improves and short sellers start taking profits and sidelined buyers return.

Be the first to comment