


What to know:
- Bitcoin exchange inflows drop to levels unseen since 2020, signaling fewer sellers.
- BTC hovers near key support while momentum weakens and volatility looms.
- Whale activity spikes as large holders move coins, creating market uncertainty.


Bitcoin shows mixed signals as inflows drop to 2020 lows while whale activity rises. On March 18, CryptoQuant analysts reported declining sell pressure despite increased whale exchange flows.
This divergence between retail holders and whales is creating uncertainty in Bitcoin’s short-term direction. Rising whale activity may limit upside and increase volatility despite reduced selling pressure.

Bitcoin Inflow Down to 2020 Levels
Darkfost, a top CryptoQuant analyst, stated that the 30-day moving average of Bitcoin flowing into Binance is down. According to him, this is its lowest level since 2020. According to the data he shared, approximately 4,900 BTC are being sent to Binance each month.
As a reference, the 30-day moving average of Bitcoin flowing into Binance has ranged from 10,000 to 15,000 BTC. The drop off in exchange inflows is an indicator that fewer investors are planning to sell.
Fewer sellers are an indication of more people holding onto their Bitcoin. Historically, those types of conditions have been associated with the bottoming process in the markets.
This is because a less available supply on exchanges means less selling pressure immediately. However, the overall economic environment continues to affect risk assets, including Bitcoin.

Source: CryptoQuant
Also Read | US Spot Bitcoin ETF’s Surge with $1.2B Inflows in 7 Days, But Lag Behind 2025 October Streak
Price Holds Key Support Level as Momentum Weakens
On March 18, according to TradingView data, Bitcoin is trading around $72,000. On the 4-hour chart, BTC is currently trading just above the 200-period exponential moving average (EMA), which is at approximately $71,100.
Currently, the 200 EMA is acting as a major dynamic support level. Momentum indicators show that strength is beginning to weaken.
After reaching nearly 64, the Relative Strength Index is currently in the low 40s. The decline in the RSI from overbought zones is indicative of decreasing strength in the bulls.
This shows that the price is testing the 200 EMA and the RSI is declining, which aligns with on-chain metrics. Therefore, if the price begins to move up, there could be resistance from increasing sell-side pressure.
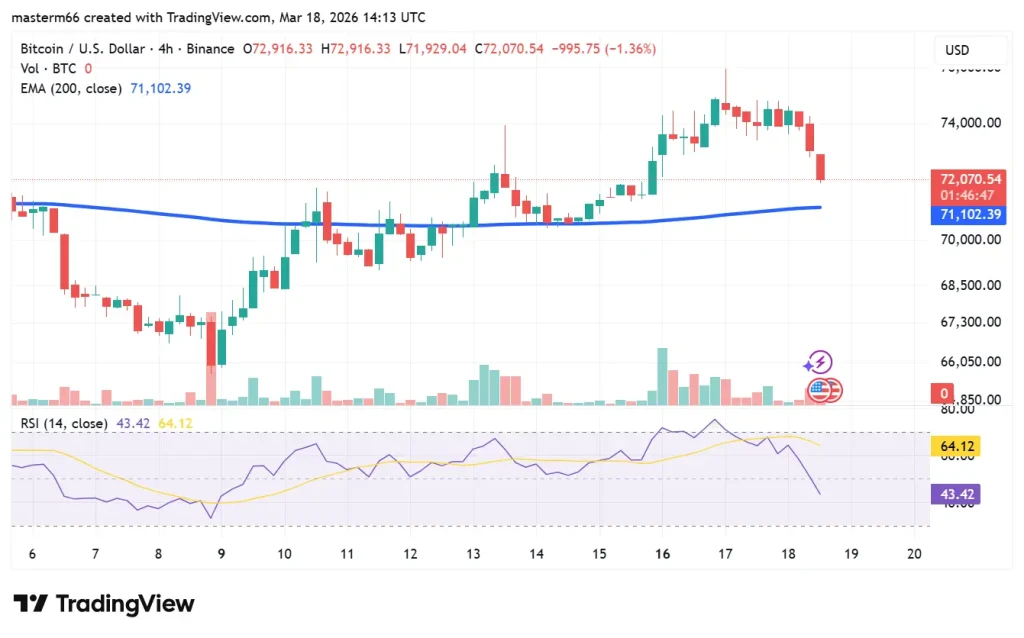
Source: TradingView
Whale Activity Indicates Increasing Selling Pressure
PelinayPA, another CryptoQuant analyst, indicated that the whale ratio for Bitcoin is increasing. In essence, a larger percentage of the flow into exchanges is from large holders.
Large transactions by whales can cause significant price changes. The analyst noted that whales are taking their Bitcoin to exchanges and selling it during minor rallies in the short-term. As whales sell their coins, it creates resistance to the price’s attempt to rally.
As these transactions occur on high-volume exchanges, such as Binance, they can impact price movements more rapidly than if they occur on other exchanges.

Source: CryptoQuant
Uncertainty in Market Outlook
The current market outlook for Bitcoin is uncertain due to the contrasting signals between whale-driven activity and decreased inflows. Reduced inflows suggest less retail investor selling pressure.
Increased whale-driven inflows suggest potential downsides and volatility. In the short term, it is possible that BTC price will trade sideways.
It could also experience a decline in price until strong demand absorbs the additional supply of coins from whales. The interaction between the 200 EMA support and the weakening momentum indicators could also determine the next directional move.
Why This Matters
Whether weakening momentum at key support can overcome increasing whale-driven selling pressure will ultimately determine the next price direction for Bitcoin.
This article contains market analysis and price predictions. These are not guarantees. Crypto markets are volatile. Always DYOR. Not financial advice.
Also Read | Bitcoin (BTC) 110 Shock: Back Warns of Dangerous Split

Be the first to comment