


TLDR
- SOL is trading near $70.67, pressing against a descending trendline
- A breakout above $80 would open targets at $90 and $95
- Tokenized equities on Solana hit a new daily volume record of $553 million
- Analyst Michaël van de Poppe sees $120–$130 as a potential target in Q3/Q4 2026
- Long-term chart patterns suggest a possible target near $500 if key resistance breaks
Solana is trading near $70.67 as of June 29, 2026, down about 1.82% in the last 24 hours. The token is holding above the $70 support level, but buyers have not yet confirmed a trend reversal.
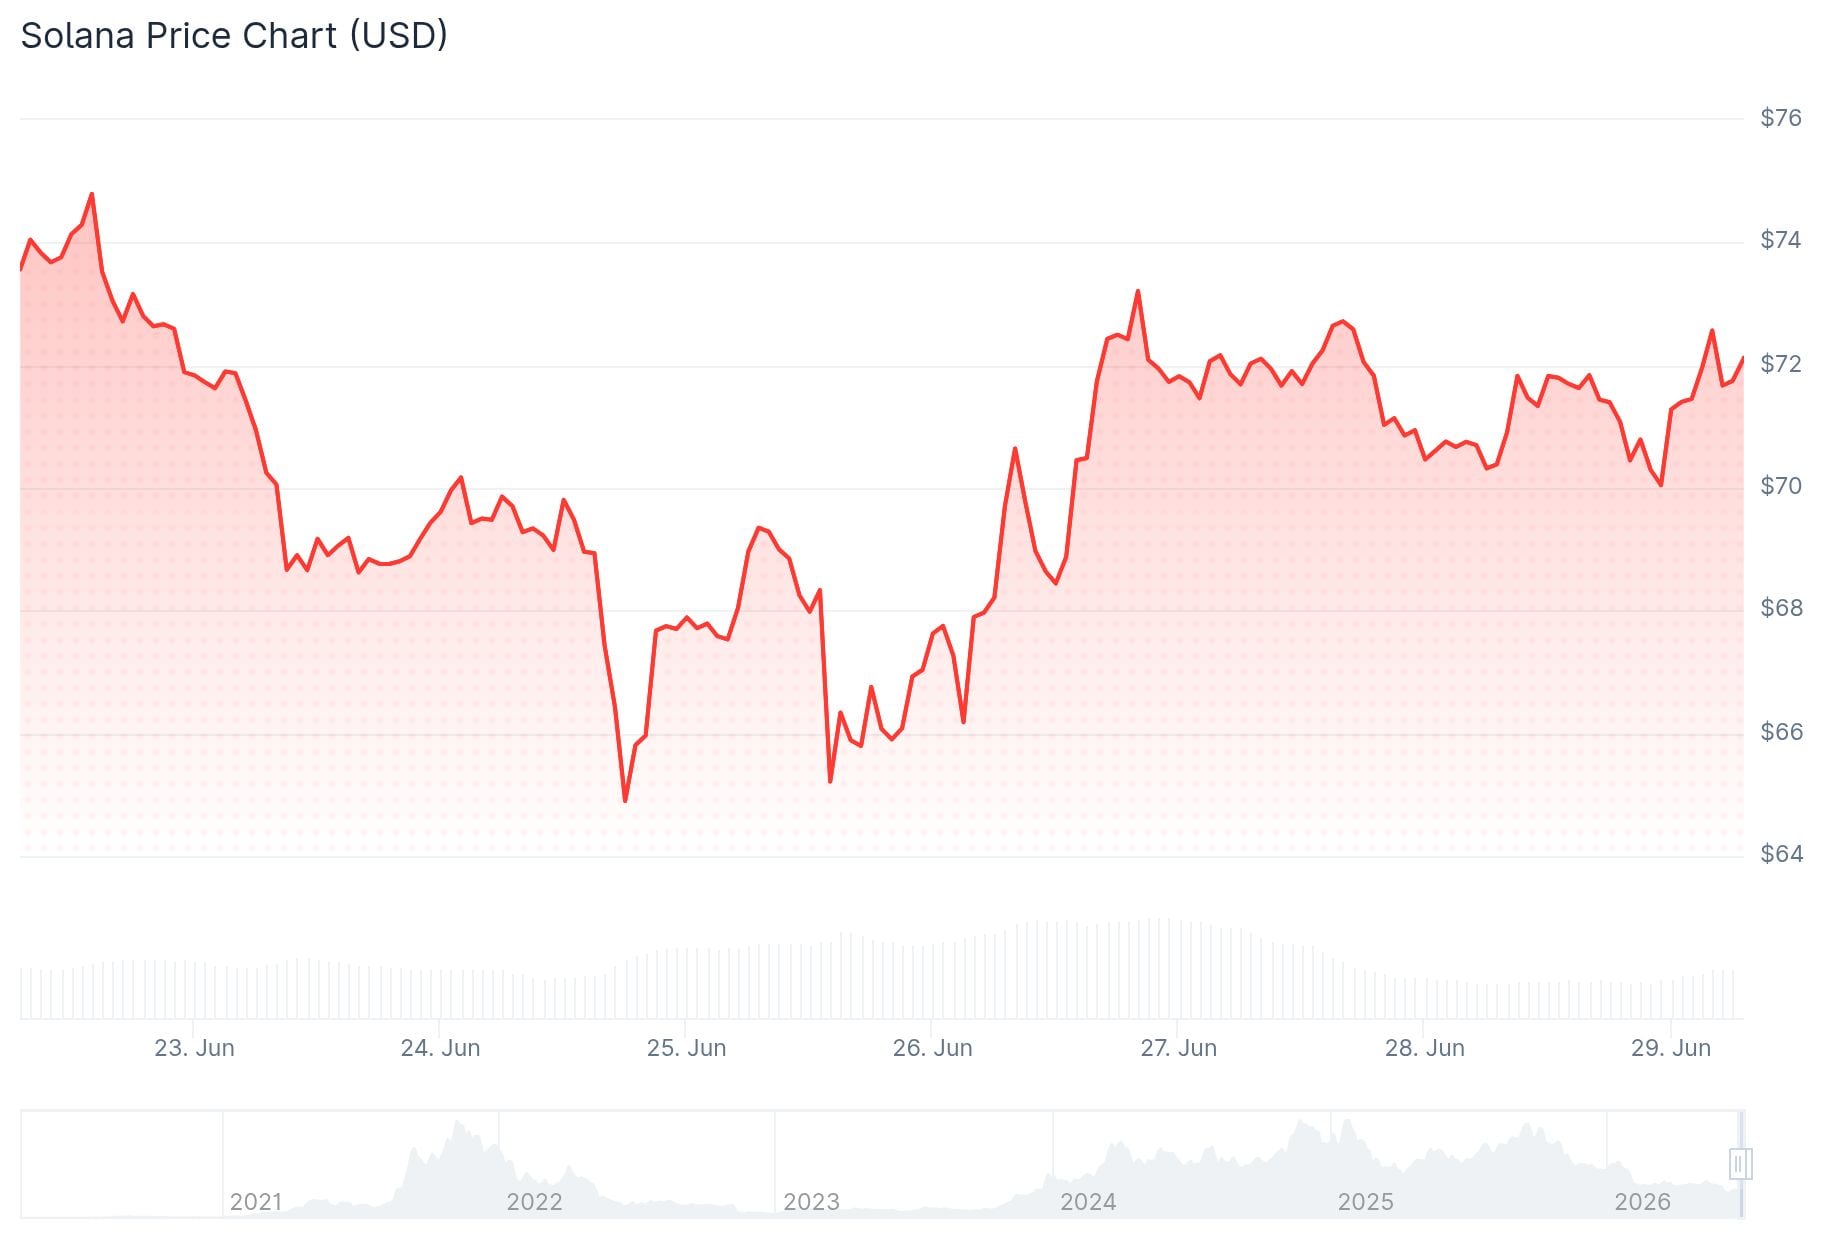
The immediate zone to watch is $72–$75. That is where a descending trendline sits, and bulls need to reclaim it before a bigger move can take shape.
If SOL breaks above $75, the next level is $80. That is the first major confirmation point traders are watching.
A confirmed close above $80 would shift short-term momentum toward buyers and put $90 and $95 in play. The $90 area lines up with visible upside liquidity on the charts.
On the downside, if SOL loses the $70 level, price could slide toward $65–$60. A deeper drop would bring the $50 liquidity zone back into view.
Analyst Michaël van de Poppe weighed in on X, saying SOL looks like it wants to break back into range. He said that if that happens, it’s unlikely to stall there, and called a range flip an easy buy opportunity. Van de Poppe added that he expects $120–$130 as a potential target in Q3 or Q4 of this year.
$SOL looks like it wants to break back in the range.
If that happens, it’s very likely not going to stall there.
The flip is an easy buy opportunity for me, but overall, I think that the markets are looking to get more upside momentum and I would expect $120-130 as a potential… pic.twitter.com/Ihwj0M9tDs
— Michaël van de Poppe (@CryptoMichNL) June 28, 2026

Network Activity Picks Up
Tokenized equities on Solana hit a new daily volume record of $553 million. Analyst Whale Factor pointed out that Solana’s on-chain use cases are expanding beyond meme coins and standard crypto trading.
Solana’s RWA ecosystem now holds $3.18 billion in total value with over 291,000 holders, making it the top blockchain by RWA holder count.
App revenue on Solana reached $19 million last week and $85 million last month. Weekly decentralized exchange spot volume came in at $12.3 billion.
Long-Term Chart Patterns
Analyst JAVONMARKS spotted a cup and handle pattern on the 12-day chart. A breakout above the $260–$280 resistance zone with strong volume would validate the pattern, with a target above $500.
Analyst Crypto Patel has a longer-term plan of buying Solana between $40–$60 and targeting $500 and $1,000. He compared the current correction to the 2022–2023 bottom that preceded the 2023–2024 rally.
My $SOL Strategy is Simple: Bought $SOL Between $60–$40.
Selling The First Bag At $500 And The Second At $1,000.
Sometimes the biggest gains come from simply holding.@solana
NFA & DYOR pic.twitter.com/VYUu7qeVZs
— Crypto Patel (@CryptoPatel) June 27, 2026
A separate falling wedge pattern also remains active on the broader chart, with a long-term target near $233 if SOL eventually breaks out of the structure.
The daily chart still needs a close above the descending trendline to confirm the bullish case. The weekly MACD has not yet crossed bullish, according to analyst Dami-Defi.
SOL last traded at $71.44, down 0.43% in the past 24 hours, per Brave New Coin data.

Be the first to comment