


What to know:
- Bitcoin is nearing its third straight quarterly loss, a pattern that previously appeared before major recoveries.
- Technical charts point to improving momentum, with analysts watching key resistance levels above $68,000.
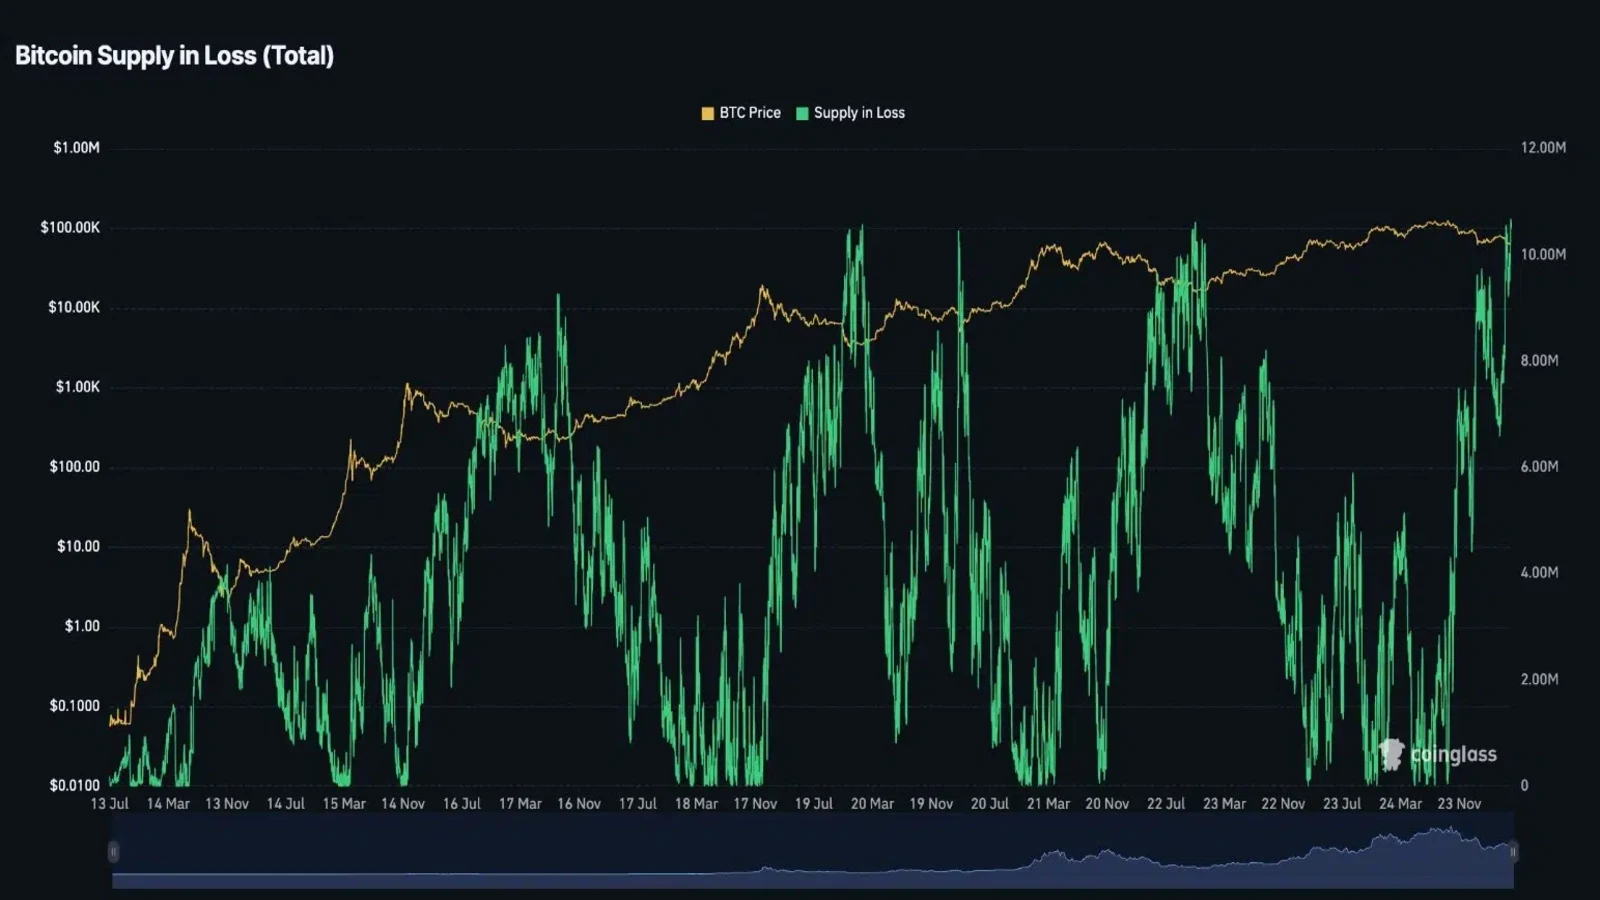
- On-chain data shows Bitcoin supply in loss has reached historic levels, a metric that has often coincided with market bottoms.

Bitcoin is approaching the close of its third consecutive negative quarter, a rare event that has only occurred three times in its history.
While the recent weakness has weighed on investor sentiment, several market observers believe historical trends, technical indicators, and on-chain data suggest the correction could be entering its final stage.
According to market analyst Henry, the asset registered three consecutive quarter losses in 2014, 2019, and 2022. Following the completion of these negative quarters, there were declines followed by a recovery in the following quarters.


Source: X
He further added that the fourth quarter performance of Bitcoin was outstanding, with gains of 215% and 168% in 2017 and 2020, respectively. It is also worth noting that the altcoin Ethereum is on track for its first three consecutive losses ever since its launch.
Also Read: Cardano Price Faces Crucial Moment as $0.092 Emerges as Key Target
Bitcoin Structure Continues to Hold Above Key Support
Another market analyst, BATMAN, noted that Bitcoin is testing the same major support level from which its bull run in 2023 began. The price is close to the lower boundary of an upward trend channel, and the weekly RSI has returned to the historical demand level.

Source: X
According to him, if the token manages to remain above $68,000, there is a possibility for it to reach a much larger target of above $140,000 if the same market pattern repeats itself. The BTC/USDT weekly chart shows that Bitcoin remains on its long-term uptrend after the 2022 low.
With the breakout from the major descending wedge formation, the price can first retest the $100,000 level, followed by $120,000 and then eventually towards $150,000-$160,000.
RSI Signals: Momentum Is Improving
The momentum is improving since the weekly RSI is now breaking the multi-year downtrend with a bullish divergence, indicating that the pressure to sell is easing. This pullback is also in line with Bitcoin’s market cycle of distribution, accumulation, and then expansion.
On-Chain Data Points to Growing Accumulation
According to Whale Factor, the supply of Bitcoin in a loss position has reached an all-time high, with over 10 million BTC transacting at values lower than what they moved in their last transaction before they recovered slightly.
Source: X
The increase indicates that there are a lot of people who had invested around the previous highs but are now experiencing losses on those positions. These supply levels have been experienced before in the 2018, 2020, and 2022 sell-offs of Bitcoin before its recovery.
Also Read: Strategy Bitcoin Faces Scrutiny Over $3 Billion Potential BTC Sale

Be the first to comment