


Bitcoin has fallen to around $60,000, more than half off its all-time high, with the Fear and Greed Index in extreme fear and momentum near oversold. Is this the bottom before the next leg higher, or a pause on the way to $55,000 and lower? Here is what the charts, the 4-year cycle, and the analysts actually say.
Summary
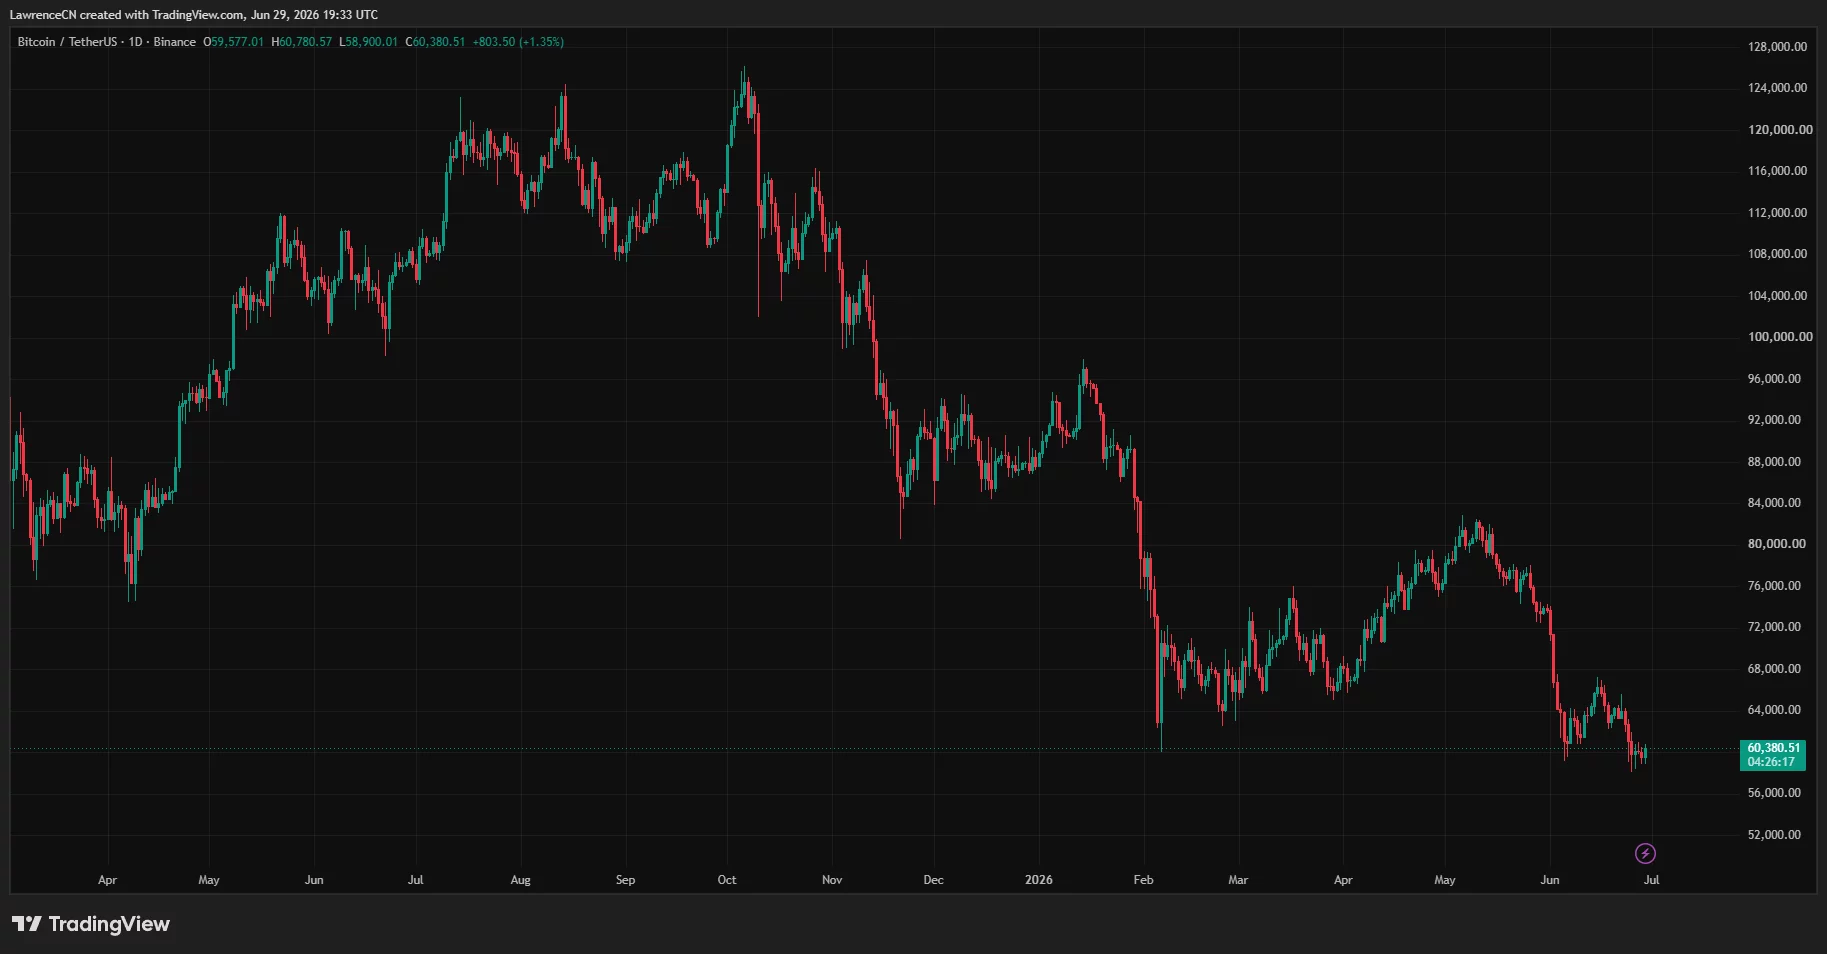
- Bitcoin trades near $60,000 as of late June 2026, down roughly 18% on the month and about 52% below its all-time high near $126,000 set late last year.
- The bottom case rests on extreme fear, oversold momentum, support holding near $58,000, and structural demand from ETFs and corporate treasuries.
- The lower case rests on a broken technical structure below every major moving average, a late-cycle position historically tied to deep corrections, and a loss of $58,000 opening $55,000 and below.
- The single most important level is the 50-month exponential moving average near $65,600; reclaiming it on a monthly close would shift the picture, while failure keeps sellers in control.
- Analyst year-end targets span an enormous range, from the low-$40,000s in bearish models to $180,000 and beyond from prominent bulls, which tells you how unsettled the outcome is.
Bitcoin (BTC) is trading near $60,000 as of late June 2026, and the question dividing traders is simple to state and hard to answer: is this the bottom, or is there more pain to come? The price sits roughly 52% below the all-time high near $126,000 reached late last year, down about 18% over the past month, with the Crypto Fear and Greed Index mired in extreme fear at a reading around 18 and the relative strength index near 31, close to the oversold zone.

Bitcoin price is stuck below the 50-month exponential moving average near $65,600, a level that has historically separated Bitcoin bull markets from bear markets, and the immediate support that bulls are defending sits near $58,100, with $55,000 the next major shelf below that. This is the kind of moment that defines cycles.
Either extreme fear and oversold momentum mark a durable low from which Bitcoin recovers, as they often have before, or the late-cycle structure resolves lower in the classic post-halving correction that history warns about. Both outcomes have serious advocates and serious evidence, and the honest answer is that the setup is genuinely balanced rather than obvious in either direction.
This article works through the question from every angle a serious trader would weigh: where Bitcoin actually stands on the charts, the strongest version of the case that $60,000 is the bottom, the strongest version of the case that $55,000 or lower is next, the specific price levels that will confirm one path or the other, where Bitcoin sits in its 4-year halving cycle and whether that framework still applies, what the major analysts are forecasting and why their numbers diverge so wildly, and finally three concrete scenarios for the rest of 2026. The aim is not to tell you what Bitcoin will do, because nobody can, but to lay out what each outcome requires so that you can watch the right signals and form your own view.
The forecasts that follow are information, not advice, and the spread among them is itself the most honest summary of where Bitcoin stands: deeply uncertain, at a level that will look in hindsight like either a generational entry or a bull trap, with the evidence today pointing both ways.
Where Bitcoin stands right now
Start with the unvarnished technical picture, because it frames everything else. Bitcoin near $60,000 is in a confirmed downtrend on the higher timeframes. It trades below the 50-month exponential moving average near $65,600, the level many long-term traders treat as the dividing line between bull and bear regimes, and well below shorter-term averages such as the 20-month exponential moving average near $80,000, which shows how far price has fallen from its recent range. The monthly candle is down sharply, around 18%, and the broader drawdown from the $126,000 peak is about 52%, a decline consistent in scale with past Bitcoin bear phases.
Momentum is weak: the monthly relative strength index sits near 31, at the lower boundary that has historically marked important bottoms but which can also stay depressed while price grinds lower. Composite technical readouts across the major analytics platforms lean bearish, with the clear majority of tracked indicators flashing sell signals rather than buy signals.
Sentiment matches the price action. The Fear and Greed Index reads around 18, deep in extreme fear, the zone where past panic-driven selling has often exhausted itself and set up rebounds, though extreme fear can also persist through further declines when a real bear market is underway.
The key support structure is well defined, which is useful: immediate support sits near $58,100, and a decisive loss of that level would expose $55,000 and then lower shelves beneath it. On the upside, the first hurdle is reclaiming the 50-month average near $65,600 on a monthly closing basis, which would be the earliest technical sign that the worst is over. Until that happens, the structure favors sellers, and the burden of proof sits with the bulls.
None of this resolves the bottom question by itself, but it maps the terrain: oversold, fearful, below the key line, defending support, with a clear level overhead that needs to be reclaimed before any recovery can be called real.
The case that $60,000 is the bottom
The bottom thesis is not wishful thinking; it rests on a coherent set of signals. The first is sentiment as a contrarian indicator. The Fear and Greed Index at extreme-fear levels has, in Bitcoin history, frequently coincided with major lows, because by the time fear reaches these readings, the holders most inclined to sell in panic have largely done so, leaving a market with less downside fuel.
The 2nd is momentum. A monthly relative strength index near 31 is close to the oversold threshold that has historically preceded recoveries, and on the weekly timeframe some analysts note RSI approaching levels that have marked important bottoms in past cycles, suggesting the correction is closer to its end than its beginning. The 3rd is the price structure itself: Bitcoin is defending support near $58,100, and as long as that floor holds on a closing basis, the bottoming case remains technically intact.
The deeper support for the bottom thesis is structural demand that did not exist in earlier cycles. Spot Bitcoin exchange-traded funds now hold very large quantities of Bitcoin, on the order of well over 1 million coins across the complex, and corporate treasuries continue to accumulate, with some holdings approaching levels that rival the largest known wallets. This persistent, price-insensitive buying provides a demand floor that earlier Bitcoin bear markets lacked, and bulls argue it changes the math of how low Bitcoin can realistically fall before institutional buyers step in.
Layer on the regulatory tailwind, with clearer United States rules advancing through the digital-commodity framework, and the bull case is that Bitcoin near $60,000 is being offered at a steep discount precisely when its structural demand base is the strongest it has ever been. In this reading, extreme fear plus oversold momentum plus a record institutional bid equals a bottom, and the people selling here are handing cheap coins to long-term accumulators. It is a serious argument backed by real flows, not merely hope.
The case that $55,000 or lower is next
The bearish thesis is equally coherent and arguably has the cleaner technical structure behind it right now. The starting point is that Bitcoin trades below every major moving average that matters, from the 50-month exponential average near $65,600 on down, and price below falling long-term averages is the textbook definition of a downtrend, not a bottom. Extreme fear and oversold momentum, the bears note, are necessary but not sufficient for a low; in genuine bear markets, both conditions can persist for months while price keeps sliding, and a reading of extreme fear is just as consistent with the middle of a decline as with its end.
The support at $58,100 is the line in the sand, and a weekly close below it would, on this view, confirm further downside and bring $55,000 into focus, with little structural support between there and lower levels once that shelf breaks.
The macro and cyclical context reinforces the bearish read. Bitcoin is roughly 26 months past the April 2024 halving, which places it deep in the late-cycle phase that has historically followed the halving with a peak and then a substantial correction.
If the cycle top was the $126,000 high reached late last year, then a 52% drawdown is well within the range of past bear-market declines, and history would suggest the correction could run deeper and longer before a true bottom forms. Bears also point to the risk that the very institutional structures bulls celebrate could amplify a decline: leveraged corporate Bitcoin treasuries that bought at higher prices may face pressure to sell if their financing terms or share valuations deteriorate, and ETF flows that were a tailwind on the way up can reverse into outflows that remove the demand floor exactly when it is needed.
In this reading, $60,000 is not a bottom but a way station; the support break to $55,000 is the more probable next move, and the late-cycle clock argues for patience over bottom-fishing.
The levels that will settle it
Rather than guess, traders can watch a specific ladder of levels that will confirm which thesis is playing out, and this is where the abstract debate becomes concrete. On the downside, the first decisive level is $58,100. A clean weekly or monthly close below it would invalidate the immediate bottoming case and open the door to $55,000, which is the next significant shelf. Below $55,000, the structure thins out, and a loss there would suggest the broader bear phase has further to run, with traders then watching round-number psychological levels and prior-cycle reference points beneath. The bears need that $58,100 break to confirm their case; until it happens, the lower targets remain hypothetical.
On the upside, the levels are equally clear. The first and most important is the 50-month exponential moving average near $65,600. A monthly close back above it would be the earliest serious signal that the downtrend is ending, because reclaiming that bull-bear line has historically preceded recoveries. Above it, the next hurdles are the 200-day moving average near $65,200, which sits close by, and then the 20-month average near $80,000, a reclaim of which would signal a genuine trend change instead of a relief bounce. The bulls need that $65,600 monthly close to confirm their case; a rejection there would keep the structure bearish even if price bounces in the meantime.
The practical takeaway is that the bottom question will be answered not by sentiment or narrative but by which of these levels gives way first. Hold $58,100 and reclaim $65,600, and the bottom case strengthens decisively. Lose $58,100, and $55,000 becomes the conversation. Everything between is noise.
The 4-year cycle and where Bitcoin sits in it
No Bitcoin price discussion is complete without the halving cycle, and right now it cuts toward caution while raising a genuine question about whether the old framework still holds. Bitcoin’s supply issuance halves roughly every 4 years, and the April 2024 halving cut the block reward to 3.125 coins. Historically, the 12 to 18 months after a halving have produced the cycle’s price peak, followed by a deep correction into the next cycle’s accumulation phase. Bitcoin is now around 26 months past that halving, which places it firmly in the late-cycle window where, in past cycles, the top was already in, and a correction was underway or complete. If history rhymes, the $126,000 high late last year was the cycle peak, and the current drawdown is the correction phase, which historically has run deep before bottoming. That reading supports patience and the lower-price case.
But there is a serious counterargument that this cycle may not behave like the past ones, and it is the crux of the most important debate in Bitcoin right now. The arrival of spot ETFs, large corporate treasuries, and institutional adoption has injected a new kind of demand that did not exist in earlier cycles, and some analysts argue this could either smooth out the 4-year pattern, blunting both the euphoric tops and the brutal bottoms, or extend the cycle by adding sustained buying that delays the peak. If the cycle is being stretched or dampened by institutionalization, then late-cycle timing alone is a weaker guide than it used to be, and a drawdown to $60,000 could be a mid-cycle shakeout instead of the start of a multi-year bear market.
The honest position is that nobody yet knows whether the 4-year cycle still governs Bitcoin or whether institutionalization has changed the rules, and that uncertainty is precisely why the bottom question is so contested. The cycle clock says caution; the structural-demand argument says this time may differ. Both could be partly right.
What the analysts are forecasting
The dispersion among professional forecasts is wide enough to be its own data point, and it reflects exactly the unresolved debate this article describes. On the bullish side, Ripple chief executive Brad Garlinghouse has pointed to $180,000 for Bitcoin in 2026 on favorable market and regulatory conditions, and Bitwise chief investment officer Matt Hougan has reiterated a $200,000 target for the year, while acknowledging he did not expect the scale of selling that hit the market on the way down.
More structured institutional views are more measured but still constructive: the head of research at CoinShares has projected Bitcoin holding a $120,000 to $170,000 range across 2026 with stronger action in the 2nd half, and Carol Alexander has described a high-volatility band of $75,000 to $150,000 with a central tendency near $110,000.
Longer-term, Bitwise has floated $500,000 as Bitcoin approaches a share of gold’s market value, and various quantitative models, from stock-to-flow to power-law frameworks, sit anywhere from $100,000 to well above $250,000.
Against those stand the cautious and bearish models. Algorithmic forecasters such as CoinCodex read the 2026 setup as bearish on technical indicators, and model-based ranges from sources like CoinLore place 2026 anywhere from the low-$40,000s at the bottom to roughly $118,000 at the top, depending on conditions, with near-term projections clustering close to current levels. The sheer gap, from a low-$40,000s downside to a $200,000-plus upside within the same year, is not a sign that forecasters are careless; it reflects that Bitcoin’s 2026 path depends on variables that genuinely could break either way, chiefly ETF flows, macro liquidity and Federal Reserve policy, and whether the 4-year cycle reasserts itself.
When the credible range is this wide, the responsible conclusion is not to pick a number but to recognize that the outcome is unusually open, and to size risk accordingly. The analysts are not telling you where Bitcoin is going; collectively, they are telling you it is a genuine coin-flip at a decision point.
What would confirm a bottom, and what would break it
Pulling the threads together, a real bottom would announce itself through a recognizable cluster of signals instead of a single one. Technically, it would start with $58,100 holding on a closing basis, followed by a monthly close back above the 50-month average near $65,600, ideally on rising volume that shows real buying instead of a low-conviction bounce. Fundamentally, it would coincide with ETF flows turning consistently positive again after any period of outflows, since that institutional bid is the demand floor the bull case depends on, and it would likely be helped by a supportive macro shift, such as the Federal Reserve easing policy or broad liquidity improving, conditions under which risk assets like Bitcoin tend to recover. A stabilization or reversal in Bitcoin dominance and a lift in sentiment off extreme-fear lows would round out the confirmation. If those align, the case that $60,000 marked the low becomes strong.
The breakdown scenario is the mirror image. It would begin with a decisive loss of $58,100, opening $55,000 and then lower levels with little support beneath, and it would be reinforced by ETF flows turning to sustained outflows that remove the demand floor. The macro trigger would be tightening conditions, a stronger dollar, or a broad risk-off episode that pulls capital out of speculative assets.
The cyclical trigger would be confirmation that the 4-year pattern is intact and the late-cycle correction has further to run. And a specific structural risk worth watching is forced selling from leveraged Bitcoin treasury companies, whose need to sell into weakness could amplify a decline well beyond what spot demand alone would produce.
The practical discipline for anyone navigating this is to treat $58,100 as the hinge: above it, with $65,600 reclaimed, the bottom case has the upper hand; below it, the lower targets become the base case. Watching those levels and those flows beats guessing, because the market itself will signal which path it has chosen.
Three scenarios for Bitcoin into late 2026
Synthesizing the evidence into scenarios makes the range concrete without pretending to certainty.
In the bull scenario, $60,000 proves to be the cycle low or close to it. Support at $58,100 holds, extreme fear and oversold momentum mark the exhaustion of selling, ETF inflows resume, and a supportive macro turn lets Bitcoin reclaim the 50-month average near $65,600 and then push back toward and beyond $80,000 over the 2nd half of 2026, validating the more constructive analyst targets and putting 6-figure prices back in view into 2027. This scenario leans on the structural-demand argument and the possibility that institutionalization has changed the cycle, and it is the path the prominent bulls like Hougan and Garlinghouse are forecasting toward.
In the base scenario, Bitcoin chops in a wide, volatile range without a clean resolution for some time. It defends the low-$58,000s to $60,000 area more often than not but struggles to reclaim $65,600 decisively, spending the rest of 2026 oscillating between roughly the mid-$50,000s and the mid-$70,000s as bulls and bears fight over the cycle question, with the outcome unresolved into 2027. This middle path fits the high-volatility ranges that measured analysts like Carol Alexander and CoinShares describe, and it is arguably the most likely outcome given how balanced the evidence is.
In the bear scenario, the late-cycle correction reasserts itself. Bitcoin loses $58,100, slides to $55,000 and then lower, ETF flows reverse, treasury-company selling amplifies the move, and the 4-year cycle plays out classically with a deeper and longer bottoming process that drags into 2027 before a new accumulation phase begins, validating the bearish models that see the low-$40,000s as a real possibility. Which scenario unfolds depends on the levels and flows described above, and the only intellectually honest stance today is that all 3 are live.
Frequently Asked Questions
Has Bitcoin bottomed at $60,000?
It is truly unresolved. The bottom case rests on extreme fear, oversold momentum near a monthly RSI of 31, support holding near $58,100, and record structural demand from ETFs and corporate treasuries. The lower case rests on Bitcoin trading below every major moving average, a late-cycle position around 26 months past the April 2024 halving that historically precedes deeper corrections, and the risk that a loss of $58,100 opens $55,000 and below. The deciding signal is whether Bitcoin holds $58,100 and reclaims the 50-month average near $65,600 on a monthly close. Until then, neither side is confirmed, and the evidence points both ways.
What is the key level to watch for Bitcoin?
The 50-month exponential moving average near $65,600 is the single most important level, treated by many long-term traders as the line between bull and bear regimes; a monthly close above it would be the earliest serious sign the downtrend is ending. On the downside, $58,100 is the critical support, and a decisive close below it would expose $55,000 and lower. The 200-day moving average near $65,200 sits close to the 50-month average and reinforces that zone, while the 20-month average near $80,000 is the level a true trend change would need to reclaim. Watch $58,100 as the hinge and $65,600 as the confirmation.
Why is Bitcoin down so much from its high?
Bitcoin is about 52% below its all-time high near $126,000 reached late last year, having fallen roughly 18% in the past month alone. The decline reflects a combination of factors: a late-cycle position about 26 months past the April 2024 halving, the phase that has historically followed the halving peak with a correction; weakening momentum and sentiment, with the Fear and Greed Index in extreme fear; and macro pressures including liquidity conditions and uncertainty about Federal Reserve policy. Whether this is a normal cyclical correction or the start of a deeper bear market is exactly the question dividing analysts, and it depends heavily on whether ETF and institutional demand offsets the cyclical downdraft.
What are analysts predicting for Bitcoin in 2026?
The range is extremely wide, which reflects real uncertainty. Bullish forecasts include $180,000 from Ripple’s Brad Garlinghouse and $200,000 from Bitwise’s Matt Hougan, with longer-term calls like Bitwise’s $500,000 tied to Bitcoin taking share from gold. More measured institutional views include CoinShares at $120,000 to $170,000 for the year and Carol Alexander’s $75,000 to $150,000 band centering near $110,000. Cautious and bearish models run lower, with ranges extending into the low-$40,000s in weak scenarios. The gap from the low-$40,000s to above $200,000 within 1 year shows that the outcome depends on variables, chiefly ETF flows, macro liquidity, and the cycle, that truly could break either way.
Could Bitcoin fall to $55,000 or lower?
Yes, it is a real possibility if support breaks. The bearish path runs through a decisive loss of $58,100, which would open $55,000 as the next major level, with thin support beneath it once that shelf gives way. The case is reinforced by Bitcoin trading below all major moving averages, the late-cycle timing that historically precedes deeper corrections, the risk of ETF flows reversing into outflows, and the specific danger of forced selling from leveraged corporate Bitcoin treasuries that bought higher. Bearish models see the low-$40,000s as possible in a weak 2026. Whether it happens hinges on the $58,100 support; as long as that holds on a closing basis, the lower targets remain hypothetical.
Is the 4-year cycle still valid for Bitcoin?
This is one of the most important open debates in Bitcoin right now. The traditional pattern, in which price peaks roughly a year or so after each halving and then corrects deeply, would place Bitcoin in a late-cycle correction now, around 26 months past the April 2024 halving, and argues for caution. But the arrival of spot ETFs, corporate treasuries, and broad institutional adoption has introduced sustained demand that did not exist in earlier cycles, which some analysts argue could smooth out the pattern, blunting both tops and bottoms, or stretch the cycle by delaying the peak. Nobody yet knows whether the cycle still governs Bitcoin or whether institutionalization has changed the rules, and that uncertainty is central to why the current bottom question is so contested.
This article is information, not financial or investment advice. Bitcoin price levels, indicator readings, and analyst forecasts reflect data available as of June 28, 2026, are point-in-time, and can change rapidly. Cryptocurrency is highly volatile, and you can lose money. Price predictions are inherently uncertain and the scenarios described are not guarantees. Do your own research and consult a qualified financial professional before making any investment decision.

Be the first to comment