


What to know:
- Dogecoin is forming a long-term falling wedge, signaling potential for a major breakout.
- Short-term resistance near $0.105–$0.11 remains a key barrier to bullish recovery.
- Momentum indicators suggest seller exhaustion, pointing to a possible relief rally if resistance is broken.


Dogecoin’s price is slowly accumulating for the long term. On the daily chart, a falling wedge is forming inside a rising support line. This indicates that the price is compressing and the range of the price swings is becoming smaller before a big move can be expected.
These types of wedges have been seen to result in a big rally for the coin once there is enough trading, and the people who are not in it for the long term start to drop out.

On March 18, analyst Ray stated that a price increase for Dogecoin could start a big meme season. Following its strong growth, Dogecoin entered a correction phase characterized by lower highs and lower selling pressure.


Source: X
Current short-term resistances cap Dogecoin’s price growth, yet it maintains its position above long-term supports as buyers defend it. The latest price lows within the wedge might indicate another shakeout before the price turns.
Also Read: Dogecoin Tests Key Resistance as Breakout Targets $0.151 Amid Bitcoin Volatility
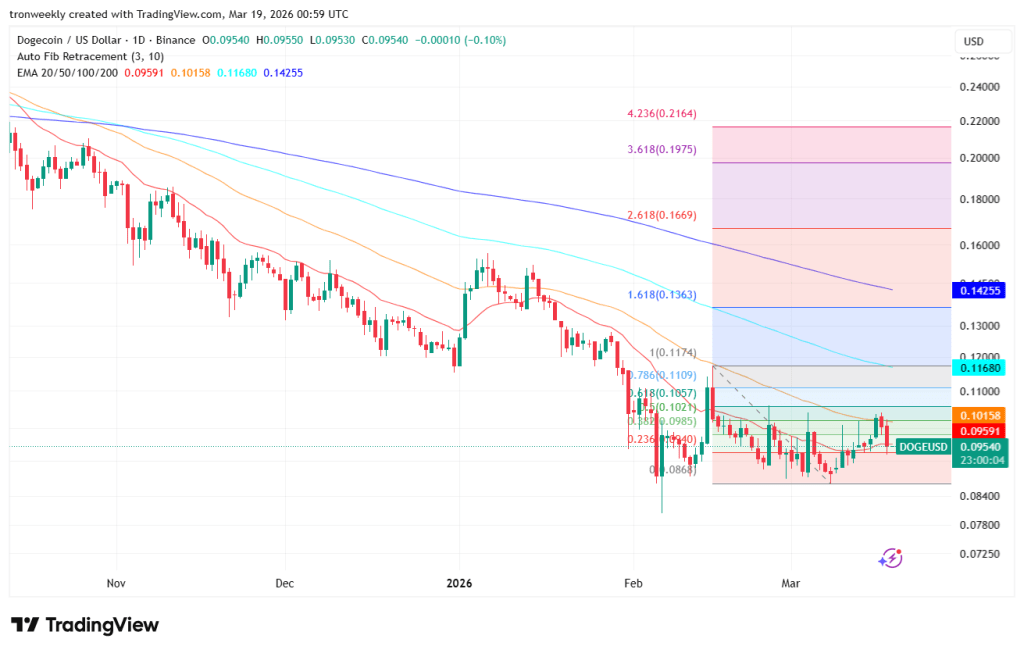
Dogecoin Short-Term Resistance Limits Recovery
Dogecoin may also have some upside potential, but it also faces significant challenges in the short term. The recent move from its local low at $0.086 ran into resistance at $0.10 to $0.105.
According to Tradingview analysis, this area corresponds to the 0.5-0.618 Fibonacci retracement levels for the last price drop and also coincides with short-term EMA clusters, thus forming a strong resistance area.
If it does not break this area, it may stay in this range or start another price drop. The market is uncertain and trading within a narrow range, which could be a bear flag or a distribution range. However, the higher lows suggest that the selling pressure is weakening.
Source: Tradingview
A decisive move above the range of $0.105 to $0.11 would mean the market is accumulating and could be on its way to the medium-term targets of $0.116 and $0.136.
Until then, any moves are just a temporary blip, and the prices remain below the key 50-, 100-, and 200-day moving averages.
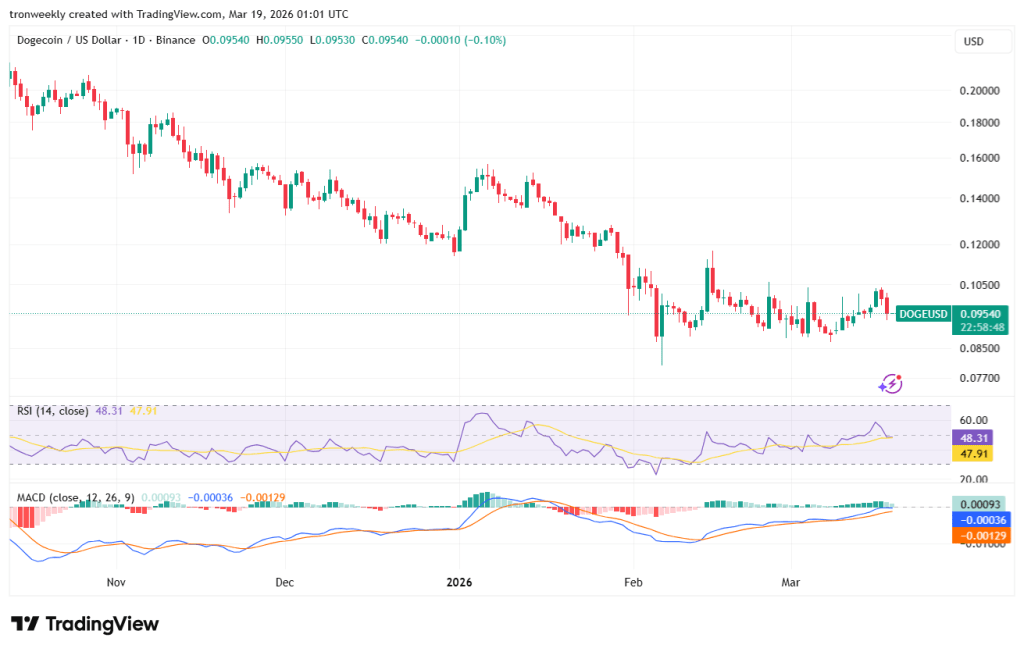
Momentum Indicators Show Seller Exhaustion
From the indicators, we can see that the downtrend is weakening and the momentum is slowly increasing. The RSI indicator has moved up from its oversold position and is currently close to the middle line.
Source: Tradingview
The RSI is showing neutral momentum with a small bullish signal. At the same time, we can see that the MACD indicator is showing that the bearish pressure is decreasing and is close to crossing over to the bullish side.
This article contains market analysis and price predictions. These are not guarantees. Crypto markets are volatile. Always DYOR. Not financial advice.
Also Read: Dogecoin (DOGE) Breakout Signal Points to Explosive $0.15 Rally

Be the first to comment