


TLDR
- SOL price is testing a major $65 to $71 demand zone after slipping to $71.37.
- More than 60 million SOL changed hands in the $65–$71 support band, making it a strong cushion zone.
- A break below $70 could expose $64, then $53.10, according to URPD data.
- RSI near 51.60 and a MACD bullish crossover suggest momentum may be turning.
- The Solana ecosystem project World Xyz revealed itself, adding fresh optimism among traders.
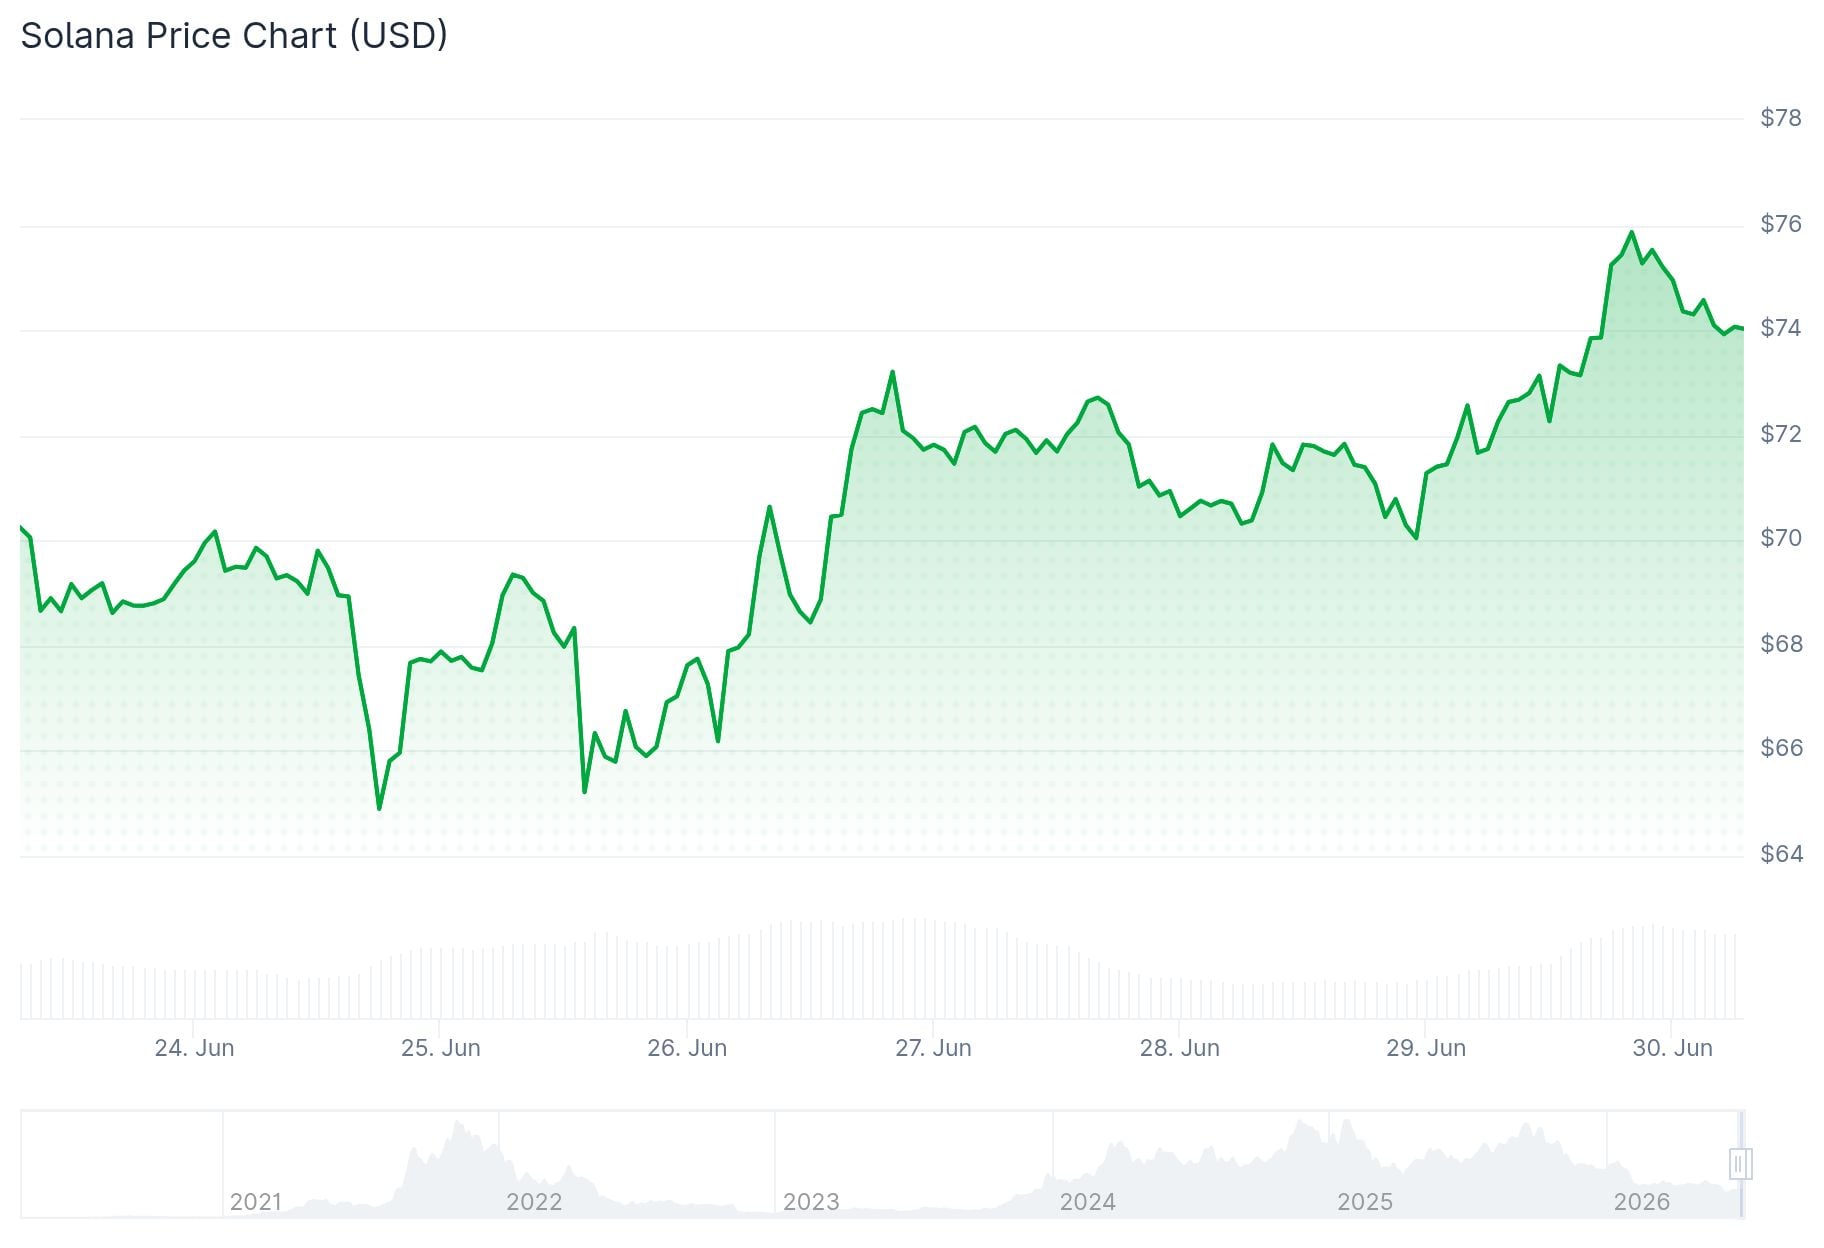
Solana price slipped to $71.37 over the past 24 hours. The drop came as Bitcoin led a wider pullback across the crypto market.
Onchain data shows more than 60 million SOL changed hands between $65 and $71. That makes this range one of the strongest nearby support zones for the token.
A large cluster of supply sitting in one price band often acts as a cushion during sell-offs. Many holders built positions there, and they may step in to defend it again.
More than 60 million Solana $SOL changed hands between $65 and $71, making this one of the strongest support zones.
As long as this demand cluster holds, the bullish structure remains intact.
If it breaks, the next major support levels based on the UTXO Realized Price… pic.twitter.com/t4lAKe7v6E
— Ali Charts (@alicharts) June 28, 2026
If SOL holds above $70, the token could keep consolidating. From there, it may attempt a retest of the $73 resistance zone.
A break below $70 changes that picture. Traders would then watch for a move toward $64 first, based on recent analyst commentary.
Lower Support Levels in Focus
If $64 fails to hold, the next levels are $53.10, $23.60, and $8.85. The $53.10 zone matters most in the short term, since around 7 million SOL changed hands there.

The current weakness is not tied to a Solana-specific event. Bitcoin fell 1.43% over the same period, and the total crypto market cap dropped 1.18%.
That shows Solana is still trading as a high-beta asset. When Bitcoin falls, altcoins tend to see faster selling pressure.
The Fear and Greed Index sits at 16, adding to the cautious mood. SOL is trading below its 30-day EMA near $72.48.
RSI on the daily chart sits near 34.83, pointing to weak momentum. MACD remains negative, though the histogram has improved slightly.
A separate analysis shows a different picture. RSI has climbed to 51.60, with the signal line at 45.95, and the MACD line shows a bullish crossover with a histogram of 0.68730.
These signals suggest selling pressure may be easing. Confirmation would require higher trading volumes and closes above resistance.
Ecosystem News and Analyst Views
The mysterious Solana project World Xyz has revealed itself after months of speculation. It had earlier purchased the world.xyz domain for $80,000.
Mysterious Solana Project World Xyz Revealed
A mysterious Solana ecosystem project, @world_xyz, has officially been revealed.
The project had reportedly acquired the domain world(.)xyz for $80,000.
Solana Foundation’s @vibhu officially unveiled World as an x402-based… pic.twitter.com/OSBKWDXGXt
— BSCN (@BSCNews) June 29, 2026
Vibhu from the Solana Foundation described World as an agentic, intent-driven settlement stack built on the x402 protocol. It is designed as a decentralized layer for tokenizing real assets.
Following the announcement, SOL price gained 2.86% over the last day. Analyst 0xNeena said a break below the $65–$75 support zone would expose SOL to further downside toward $50–$55.
On X, analyst Sjuul of AltCryptoGems wrote that SOL “has been showing some strength on lower time frames” but added that “on higher time frames it is still in trouble.” Sjuul said a proper recovery depends on SOL reclaiming the $78 level.
$SOL has been showing some strength on lower time frames.
But make no mistake, on higher time frames it is still in trouble.
The only way we can start to see a proper recovery is by reclaiming the key support level at $78. pic.twitter.com/J3ltRl5zQU
— Sjuul | AltCryptoGems (@AltCryptoGems) June 29, 2026
Solana trading volume reportedly jumped more than 3,200% in the second quarter, reaching $67 billion. Memecoins, staking activity, and other use cases helped drive that increase.
Solana ETF fund flow data showed $5.8 million in outflows in June. A $15 million short position has also raised questions about whether the current pullback could deepen.
CryptoPatel pointed to a broader support zone between $40 and $60, with long-range targets at $500 and $1,000 if SOL reclaims higher resistance later. Analyst Ardi suggested one final washout below current lows is still possible before any larger recovery begins.

Be the first to comment