


Ethereum is sitting on the line that has defined its entire structure since the last bear market, and it’s testing it under real pressure.
Key Takeaways
- ETH trades at $1,615.80, sitting almost exactly on a trendline held since mid-2022.
- Price is below both its 50-month and 100-month moving averages.
- Ethereum spot ETFs have seen eight straight weeks of outflows.
- Whether the trendline holds depends on flows and macro, not the chart alone.
ETH trades at $1,615 at the time of writing, up 3.5% for the past 24h, resting almost exactly on an ascending trendline that has held as support since mid-2022. The entire post-2022 structure rests on this line, and it’s being tested while momentum is weak and institutional money is leaving.
The Make-or-Break Level?
The technical setup is unusually clean. The ascending trendline connects the 2022 bear-market bottom near $1,000 through a series of higher lows, and price has just wicked down to test it again, with the current monthly candle showing a small green recovery off the low. This may be a genuine make-or-break level: hold it, and the multi-year structure stays intact; lose it on a monthly close, and that structure breaks.
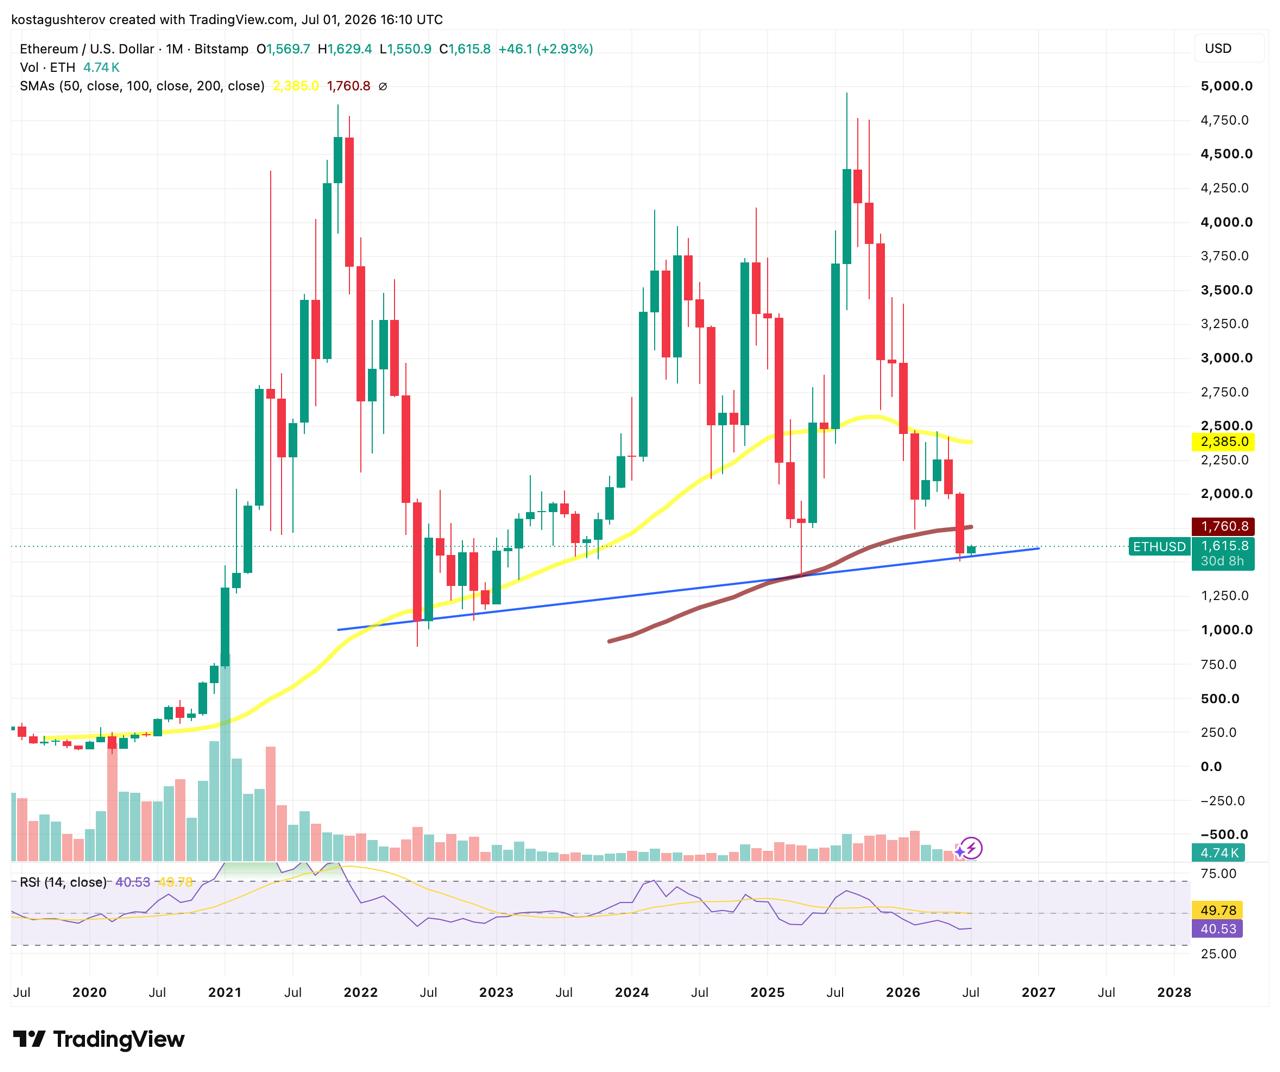
The moving averages sit overhead as resistance, not support. The 50-month SMA is at $2,385 and the 100-month at $1,760.80, and price at $1,616 is now below both. That matters because the 100-month had been acting as a secondary support shelf; with price beneath it, ETH is leaning entirely on the ascending trendline. Monthly RSI at 40.53, below the midline and declining, confirms the test is happening under pressure rather than from strength.
Eight Straight Weeks of Outflows
The flow backdrop tells the same story as the price. Ethereum spot ETFs have bled for eight consecutive weeks, with no positive week in the run:
| Week Ending | Net Flow |
|---|---|
| May 15 | -$255.11M |
| May 22 | -$215.99M |
| May 29 | -$241.45M |
| Jun 5 | -$173.05M |
| Jun 12 | -$14.91M |
| Jun 18 | -$10.05M |
| Jun 26 | -$273.34M |
| Jun 30 | -$57.64M |
That’s a sustained, uninterrupted institutional redemption streak lining up exactly with the price decline into the trendline. The flows and the price weakness are one story: persistent selling with no offsetting institutional bid.
Where the Institutional Push Fits
This is the environment the newly launched Ethereum Institutional non-profit, anchor-funded by BitMine, SharpLink, and Joseph Lubin, is built for – accelerating the institutional adoption of ETH. Its framing, that Ethereum’s “neutrality without representation can be received as silence” and that institutions need a dedicated advocate “in the room”, reads as a direct response to exactly what the flow data shows: institutions pulling back with no coordinated voice selling ETH as the base layer for tokenization and on-chain finance. Its arrival amid eight weeks of outflows could not be coincidental to the broader narrative.
1/ Announcing Ethereum Institutional
An independent non-profit dedicated to accelerating the institutional adoption of Ethereum, its L2s, applications and overall ecosystem. pic.twitter.com/XUeViH6rrq
— Ethereum Institutional (@ethereuminsti) July 1, 2026
The Macro Caveat
The past month’s crypto weakness has been partly macro-driven, with the US-Iran conflict fueling a broad risk-off move alongside unchanged rates and a strong dollar. ETH’s slide into the trendline isn’t purely an Ethereum-specific story, it’s largely the macro tide pulling the whole market down because of the broader uncertainty. That cuts both ways: the test may resolve more on macro sentiment shifting than on Ethereum fundamentals, and a flow reversal, if it comes, could likely need a macro catalyst as much as an adoption one.
What Needs to Change
Put together, this is a clean conditional, and it has to stay conditional rather than predictive. ETH is holding a trendline that has defined its structure since 2022, but it’s doing so with weak momentum, below both major moving averages, and against eight straight weeks of negative flows. For the line to hold and an uptrend to resume, the flow picture needs to turn, which is exactly where the institutional-adoption push becomes relevant. If efforts like Ethereum Institutional bring institutions back as buyers, and if the war-driven risk-off eases, the ETF outflows could flip to inflows and provide the demand to defend the trendline and press back toward the averages overhead.
None of that is guaranteed. If outflows continue and macro stays risk-off, the trendline that has held since June 2022 becomes the last line of defense, and a monthly close decisively below it would break the multi-year structure. The chart describes proximity to a decision point; the flows and macro describe the forces that will resolve it; the institutional push describes the mechanism that could tip it toward holding. ETH sits at a genuine inflection where the technical level, the flow trend, and the macro backdrop all have to align for the bullish case to hold.
This article is for informational purposes only and does not constitute financial advice. Consult a professional before making investment decisions.

Kosta has reported on cryptocurrency markets and blockchain infrastructure since 2020, bringing over six years of hands-on experience in the crypto industry built through daily tracking of markets, trends, and emerging blockchain developments. Specializing in Bitcoin on-chain analysis, institutional ETF flows, and digital asset price action, his work at Coindoo has been cited by other news agencies and consistently covers market developments with a focus on data-driven reporting across Bitcoin, Ethereum, Solana, and XRP.
Over the years, Kosta has contributed to multiple crypto media outlets in different regions, authoring over 6,000 articles across the sector. His reporting spans cryptocurrency markets and the broader fintech industry, tracking not only price action but also the technological and regulatory forces shaping the ecosystem.
To support his analysis, Kosta actively leverages on-chain data and metrics from leading platforms such as Santiment, Glassnode, and CryptoQuant, enabling deeper, evidence-based market insights. He believes in the power of transparency and the data that underpins the blockchain ecosystem.
His academic background in Marketing Management from Denmark further complements his analytical approach, adding a strong understanding of communication strategy and content positioning to his work.

Be the first to comment