


June 2026 was a structurally significant month for Bitcoin, not just a down one. The clearest evidence is in the ETF data: spot Bitcoin funds bled capital continuously, without a single positive week.
Key Takeaways
- Bitcoin spot ETFs saw net outflows every week through June.
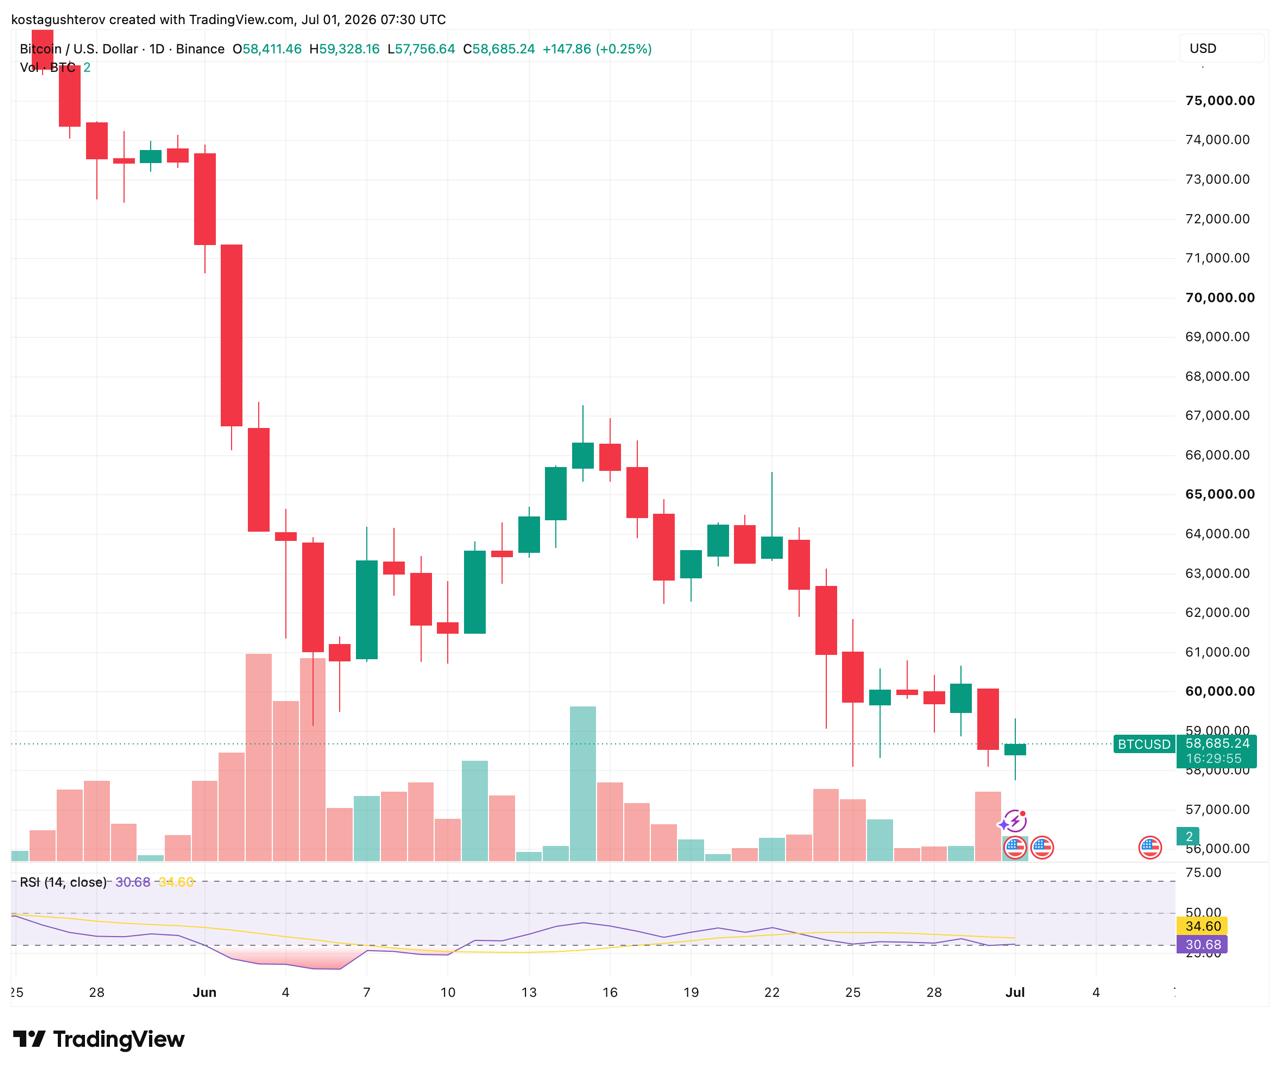
- BTC fell from around $73K to $58K, its lowest since September 2024.
- Each Bitcoin cycle has needed far more capital for a smaller percentage return.
- Selling pressure and accumulation signals intensified at the same time.
That sustained institutional redemption, alongside a sharp price drop and a notable on-chain divergence, is what makes June read as a shift in market structure rather than a simple selloff.
The Hard Data: ETF Outflows With No Green Days
The most concrete evidence is the ETF flow record, and it’s one-directional. Every weekly and daily reading through June was negative.
| Week Ending | Net Flow |
|---|---|
| May 29 | -$1.42B |
| June 5 | -$1.72B |
| June 12 | -$315.84M |
| June 18 | -$226.84M |
| June 26 | -$1.79B |
| June 30 | -$453.74M |
The two heaviest weeks bracketed the month: the week ending June 5 at -$1.72B and the week ending June 26 at -$1.79B. On a daily basis, June 25 was the single worst session at -$696.29M, followed by June 24 at -$469.08M and June 26 at -$444.51M. Summed across the stretch, the weekly figures alone exceed $5.9 billion in net outflows. This is sustained, one-directional institutional redemption, and it’s the hardest data point in the picture.
The Price: Back to September 2024 Levels
The price followed. Bitcoin fell from around $73,600 on 1st of June to as low as $57,700 on June 30th, its lowest level since September 2024, with price now attempting to stabilize just above it near $58,700 after a marginal green candle. RSI sits at 30.68, right at the oversold threshold, having spent the back half of June grinding lower alongside price. The move is consistent with the risk-off macro backdrop of the period, elevated rates and a strong dollar, and with the ETF-driven redemption running underneath it.
Ki Young Ju: Each Cycle Buys Less
The most analytically interesting addition comes from CryptoQuant CEO Ki Young Ju, whose argument is about declining capital efficiency across Bitcoin’s cycles. The figures from his chart are stark:
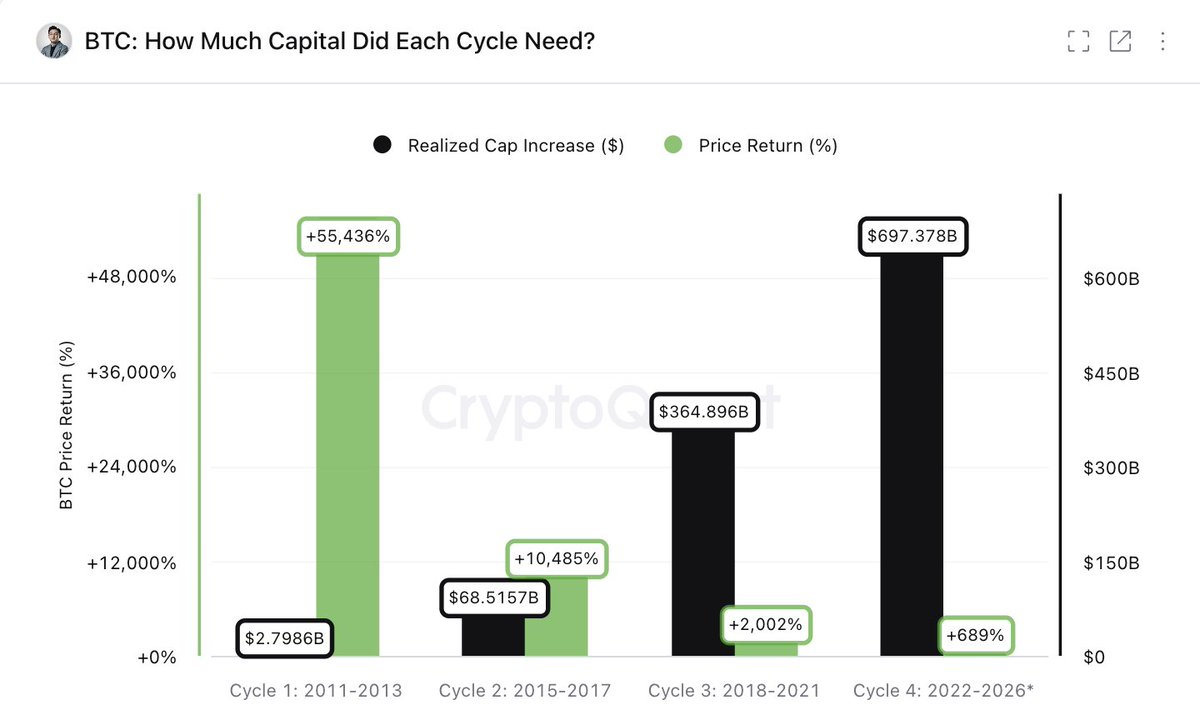
The pattern is unambiguous: each cycle has required exponentially more capital to produce a progressively smaller percentage return. That’s the natural consequence of a maturing, larger asset, the same dollar inflow moves a $2 trillion Bitcoin far less than it moved a $1 billion one.
From there, Ki Young Ju makes a forward argument that is explicitly his interpretation, not established fact. He contends the next parabolic cycle likely requires deeper institutional allocation, that Bitcoin needs to become a core macro asset rather than a retail-driven ETF trade, and that if it can absorb $1 trillion or more in realized cap, another parabolic run remains possible. He anchors that against gold’s roughly $27 trillion market cap as the comparison ceiling, and frames the institutional shift as “still early, not invalidated.” That’s a bull-case reading of the same data, and it should be weighed as his view rather than a forecast.
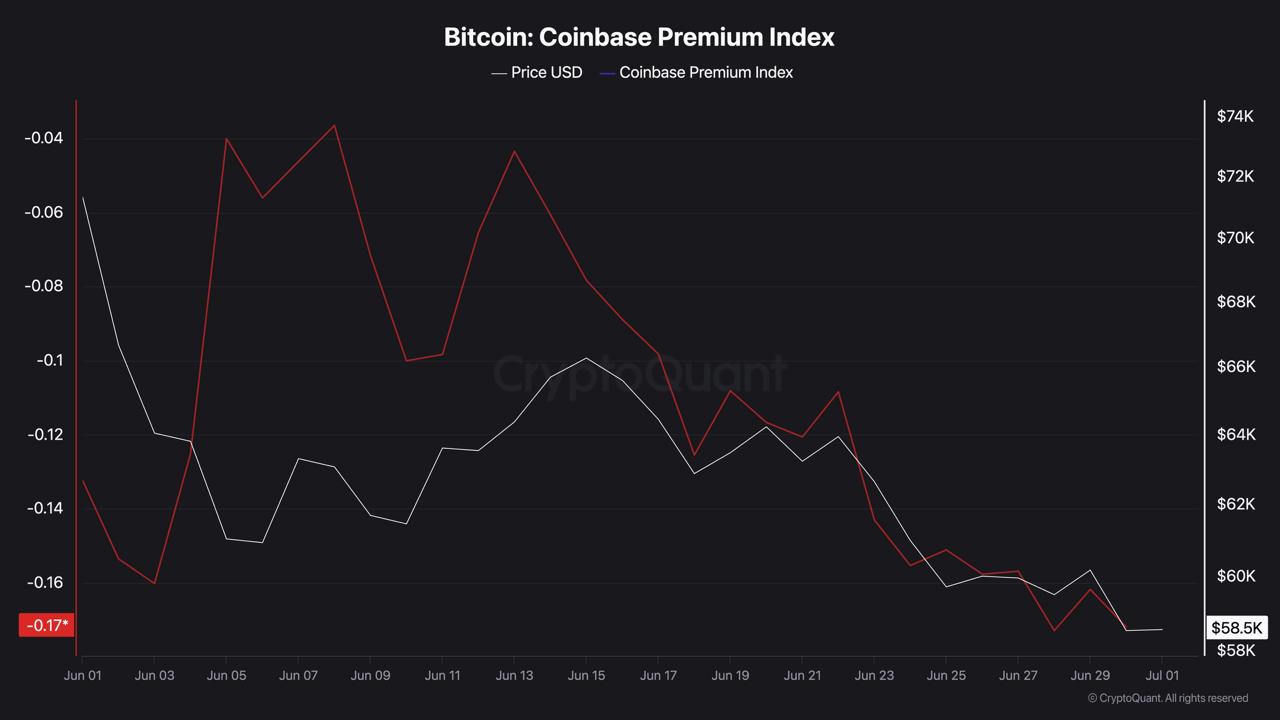
The Divergence: Selling and Accumulation at Once
One of the most interesting structural feature of June worth attributing rather than stating flatly, is that two opposite forces intensified together. On the selling side, the Coinbase Premium Index stayed negative through the month, pointing to weak US institutional spot demand, and Apparent Demand stayed deeply negative, meaning new buying wasn’t enough to absorb supply.
On the other side, long-term holders kept holding, and whale accumulation stayed resilient while short-term holders were the ones panic-selling.
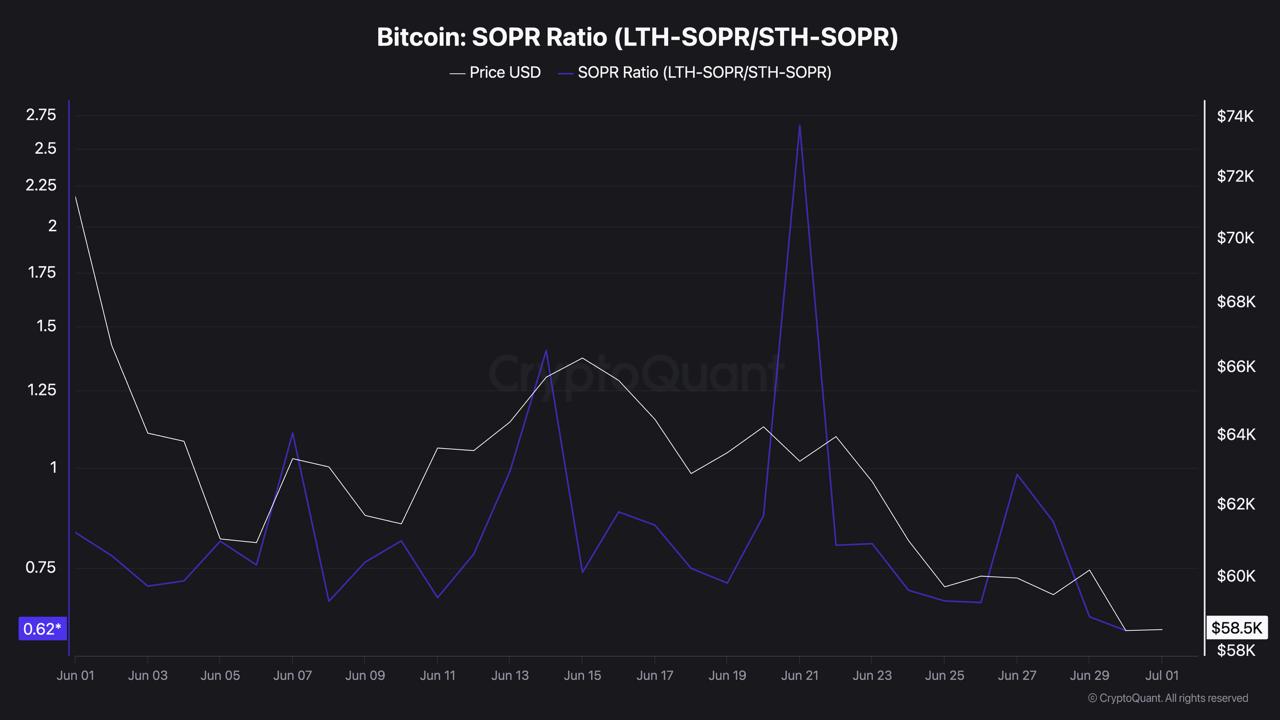
That combination is the “transition, not collapse” thesis. Selling pressure from ETFs, negative premium, and negative apparent demand rose at the same time as accumulation signals from long-term holders and whales strengthened. Both were true at once, which is what distinguishes a structural handoff from a straightforward capitulation.
The Valuation Backdrop
Two valuation readings add context, and both need careful framing. MVRV declined toward undervaluation territory, and market price approached Realized Price, the on-chain average acquisition cost across the market.
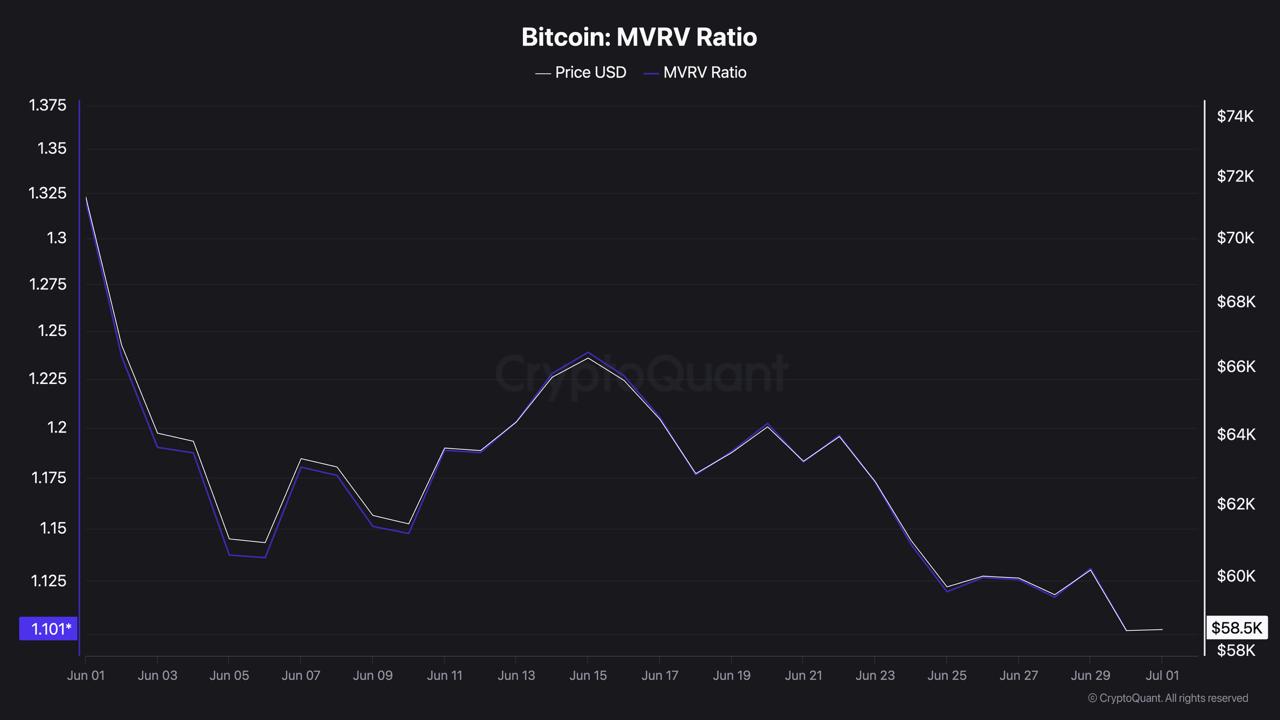
That proximity to realized price is a level historically associated with cycle bottoms. The important word is “historically associated”: it describes a past pattern, not a prediction. Price nearing realized price has coincided with bottoms before, but it doesn’t guarantee one now, and it isn’t a timing signal on its own.
What Actually Decides the Next Move
Stripped to essentials, June gave a clear read on the present and an open question about what comes next. The confirmed picture is a month of relentless ETF outflows, a drop to September-2024 price levels, and a maturing asset whose returns per dollar keep shrinking. The interpretive layer, whale resilience, undervaluation signals, proximity to realized price, points to accumulation happening beneath the selling, but none of it forecasts direction.
What resolves it could be the flow, not price. The signals worth watching are the ones that turned June negative in the first place: whether ETF flows stop bleeding and turn positive, whether the Coinbase Premium recovers, whether Apparent Demand climbs back above zero, and whether overall liquidity returns. A price bounce alone wouldn’t confirm the transition; a recovery in those flow metrics could.
This article is for informational purposes only and does not constitute financial advice. Consult a professional before making investment decisions.

Kosta has reported on cryptocurrency markets and blockchain infrastructure since 2020, bringing over six years of hands-on experience in the crypto industry built through daily tracking of markets, trends, and emerging blockchain developments. Specializing in Bitcoin on-chain analysis, institutional ETF flows, and digital asset price action, his work at Coindoo has been cited by other news agencies and consistently covers market developments with a focus on data-driven reporting across Bitcoin, Ethereum, Solana, and XRP.
Over the years, Kosta has contributed to multiple crypto media outlets in different regions, authoring over 6,000 articles across the sector. His reporting spans cryptocurrency markets and the broader fintech industry, tracking not only price action but also the technological and regulatory forces shaping the ecosystem.
To support his analysis, Kosta actively leverages on-chain data and metrics from leading platforms such as Santiment, Glassnode, and CryptoQuant, enabling deeper, evidence-based market insights. He believes in the power of transparency and the data that underpins the blockchain ecosystem.
His academic background in Marketing Management from Denmark further complements his analytical approach, adding a strong understanding of communication strategy and content positioning to his work.

Be the first to comment