


What to know:
- Hyperliquid $HYPE shows a strong bullish recovery after a corrective phase, forming higher highs and higher lows.
- Moving averages and momentum indicators signal a developing uptrend, but short-term pullbacks are possible.
- Key resistance sits at $42–$44; support zones at $36–$32 may provide buying opportunities if a retracement occurs.


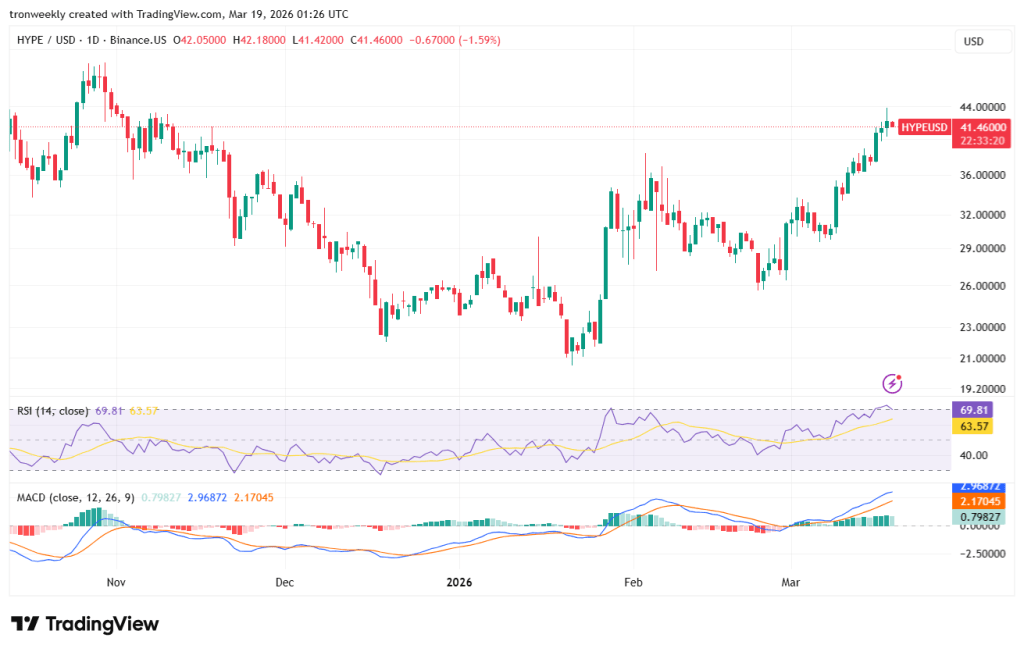
Hyperliquid (HYPE) has been on a remarkable rebound after a prolonged downtrend that lasted from November through mid-January. As per the data from TradingView, the asset has made a major bottom at a price of $22 following a sharp fall.
From there, $HYPE has been on a sharp rise in a V-shaped movement, as evidenced by strong bullish candles. Since then, the asset has been making higher highs and higher lows, a clear change from a bearish to a bullish trend.

This recovery strengthened as the price continued to rise past the middle consolidation area of $30. The price level of $30, which was once a point of resistance for the price, is currently providing support.
The price formation shows that the market is gaining confidence and that the momentum is set to continue.

Source: TradingView
Also Read: Hyperliquid Sees Strong Growth With $50M Inflows and Record HYPE Trading
Hyperliquid Technical Indicators Support Ongoing Rally
Moving averages indicate that there is bullish momentum in $HYPE. The short-term 20 EMA is currently crossing over the 50 EMA. Both EMAs are rising, which is good.
The price is currently above the 100 EMA and is nearing the 200 EMA. The 200 EMA is the major resistance level. If the price is able to break through this point, it may attract more trend-following investors to the market.
The momentum indicators also support the bullish case. The RSI is close to 70. The strong buying is evident as the RSI is close to overbought levels.
The strong trend is evident; it is likely that the price may consolidate or fall slightly in the near future. The MACD indicator shows a bullish crossover and increasing positive bars on the histogram.
Source: TradingView
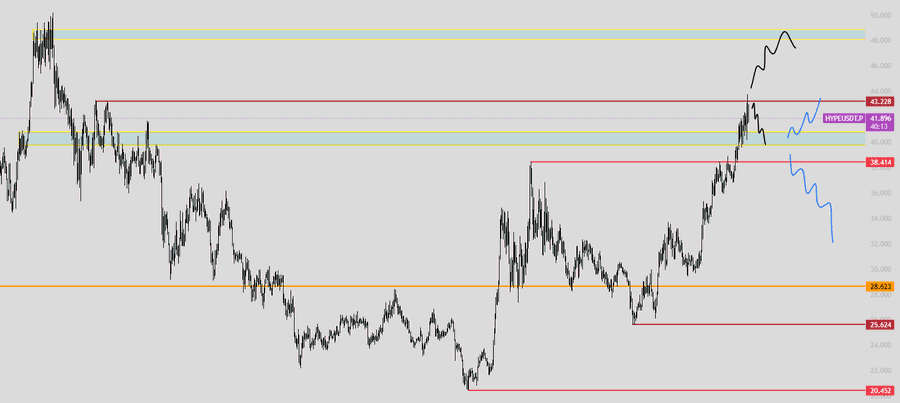
$HYPE Faces Key Resistance Between $42 and $44
From a price action perspective, HYPE is strong resistance between $42 and $44. It is a previous area of supply. If a breakthrough here is achieved, the uptrend may resume to other psychological levels.
Market analyst Mizer stated that if HYPE is unable to hold above the range of $42 to $44, it could potentially pull back to support levels around $40 to $38, or even as low as $36 to $32. These are where significant levels of moving averages could see buyers return to the market.

Source: X
Another point that Mizer noted was how HYPE’s price action was closely correlated with Bitcoin, and thus the market’s overall direction would determine whether HYPE was able to hold support during a short-term pullback.
This article contains market analysis and price predictions. These are not guarantees. Crypto markets are volatile. Always DYOR. Not financial advice.
Also Read: Hyperliquid enables 24/7 S&P 500 perpetual trading on blockchain.

Be the first to comment