


What to know:
- HBAR price tests $0.074-$0.08 resistance as bulls seek a stronger breakout move.
- CoinLore data shows HBAR support at $0.0642 and key upside resistance at $0.0793.
- CoinGlass shows futures volume fell 6%, while open interest rose to $95.03 million.

HBAR price came under focus on Thursday, July 2, as Hedera traded near a key resistance area after a recent rebound. Traders watched whether buyers could extend momentum while market data showed mixed signals across spot and derivatives activity.
As of press time, Hedera (HBAR) is trading at $0.07404 with a 24-hour price increase of 3.38%. CoinMarketCap data shows that its 24-hour trading volume is $60.22 million, down 10.28% in the period. The token has also surged by 2.79% over the past week.
Also Read: Litecoin Price Holds $42 as MiCA Boosts Market Confidence

HBAR Price Tests $0.08 Breakout Zone
A prominent analyst, More Crypto Online, pointed out that HBAR is currently testing the wave 2 resistance of wave (3) in the yellow scenario.
The significance of this level is that it lies near the current breakout zone. The analyst identified the price range between $0.074 and $0.08 as a crucial zone to monitor.
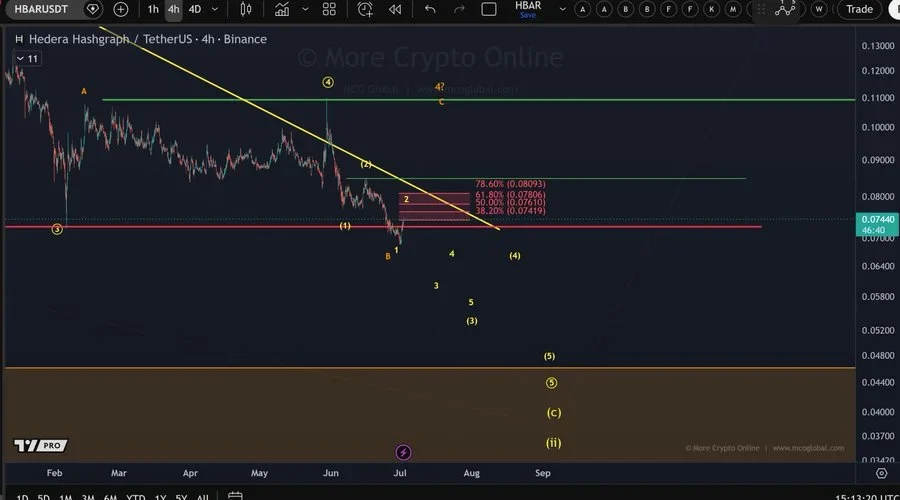

A clean break over this range could alter the short-term structure. It could open the way for a wider wave 4 flat correction under the orange alternative scenario.
If the price action maintains momentum beyond the resistance, this would allow the HBAR price to be in a more favorable position.
CoinLore data shows that HBAR had short-term support at $0.0642. It also showed immediate resistance at $0.0793, based on recent HBAR price movement.
If the token crosses $0.0793, it may return to a higher trading range. The next resistance is $0.0882, and a more potent rally may push $0.1009 into play.
If the bounce begins to wane, support is still critical. The next support level to monitor is around $0.0548 in the event that HBAR drops below $0.0642.
HBAR Trades Below Key Moving Averages
According to the TradingView data, the HBAR price remains close to short-term moving average pressure. The 20-day EMA stood at $0.07574, while the 50-day EMA stands at $0.08097. The setup has the token under significant daily chart key moving averages.
The higher time frame EMA levels remained above the current market price, indicating broader resistance. The 100-day EMA is at $0.08704, and the 200-day EMA stood at $0.10253.
The Bollinger Band (BB) data shows the middle band at $0.07643, the upper band is at $0.08482, and the lower band sits at $0.06805. HBAR price is below the mid-band and above the lower band.
HBAR Open Interest Rises as Volume Drops
CoinGlass data shows mixed positioning in the market. The future trading volume dropped 6.00% to $96.39 million, while open interest increased 2.99% to $95.03 million. The OI-weighted funding rate stood at 0.0099%.
Liquidation data revealed some forced selling in the last 24 hours. Total liquidations amounted to $35.98K, with long and short positions valued at $5.24K and $30.74K, respectively.
This article contains market analysis and price predictions. These are not guarantees. Crypto markets are volatile. Always DYOR. Not financial advice.
Also Read: Stellar Price Breakout Targets $0.24 as Bullish Momentum Accelerates

Be the first to comment