


What to know:
- The ONDO price holds near its breakout area as traders watch former resistance support.
- Analyst eyes $0.321-$0.323 retest, with upside targets from $0.340 to $0.363 next.
- EMA and Bollinger data keep ONDO near mid-range, with $0.321-$0.323 as a key zone.

ONDO price stayed in market focus on Friday, July 3, as the token consolidated near its latest breakout area. The move kept traders watching whether buyers could protect the former resistance zone and support another upward attempt.
As of press time, ONDO price trades at $0.3334 after rising 0.49% in 24 hours, while trading volume fell 35.5% to $55.02 million, as per CoinMarketCap data. The token has gained 4.72% over the last week as traders watched the latest breakout area near current price levels.
Also Read: Cardano Price Forecast: ADA Bulls Target $0.23 Amid Strong Whale Activity

ONDO Price Eyes $0.363 as Breakout Zone Holds
Popular analyst Cryptorphic revealed that ONDO had emerged from a significant resistance area and maintaining its position above it. The analyst noted that the price is now consolidating, which is healthy after the strong move. That view kept attention on whether buyers can protect the former resistance area.
The analyst is waiting for a retest of the breakout area ranging from $0.321 to $0.323. The analyst stated that the area could provide a long entry setup if the buyers defend it. Market data indicates that the price is coming near the recent support range.
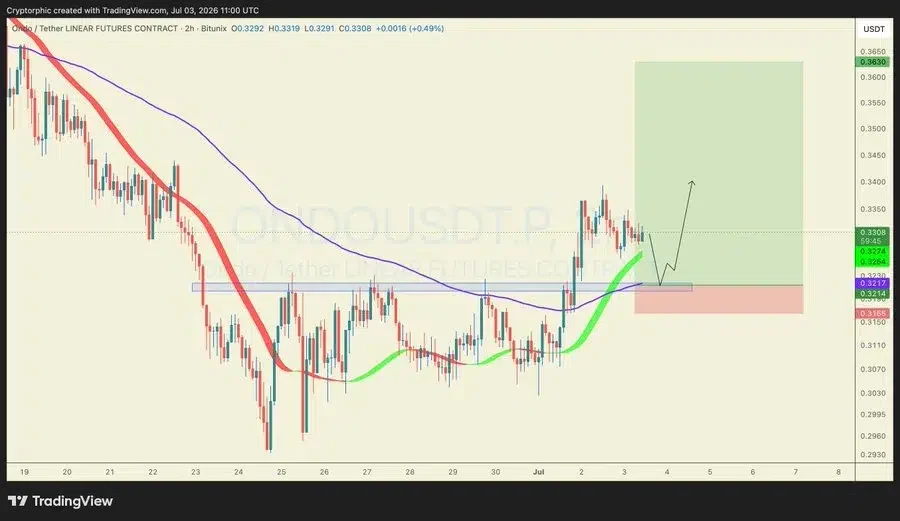

The stated upside targets were $0.340, $0.350, and $0.363. The stop loss was placed below $0.316, keeping the breakout zone central to the short-term trade view. These levels are near the moving average cluster with the first level coming in.
ONDO Breakout Risk Builds Near Support Zone
According to CoinLore data, short-term support stands at $0.3104. The data also shows resistance at $0.3764, based on recent ONDO price movement. If the breakout retest weakens, $0.3104 will remain the first downside zone.
A move above $0.3764 has been associated with higher price levels. The next resistance areas were listed at $0.4620 and $0.5829, while the support zone stood near $0.2089 if $0.3104 fails. This maintains a clean upper and lower band on the chart.
Open Interest Rises as Futures Volume Falls
Derivatives data revealed a divergence between activity and positioning. According to CoinGlass data, the future trading volume fell by 31.65% to $138.14 million, while the open interest increased by 7.50% to $151.28 million. The ONDO OI-weighted funding rate stood at 0.0044%.
Price Trades Near EMA Cluster as Bands Tighten
According to TradingView data, ONDO price is trading close to the short-term moving average cluster. The 20-day EMA stood at $0.3317, while the 50-day EMA stands at $0.3404. This put the market close to its low EMA but below the 50-day line.
The 100-day EMA stood at $0.3382. The 200-day EMA level was also higher at $0.3833, keeping ONDO’s price below the longer-term trend marker on the daily chart. The data kept the 200-day EMA as the highest listed average.
Bollinger Band data shows the middle band at $0.3346. The upper band stands at $0.3791, while the lower band is at $0.2900. ONDO price hovered around the midline, maintaining the token in its daily range. This reduced the immediate watch zone to $0.321 to $0.323.
This article contains market analysis and price predictions. These are not guarantees. Crypto markets are volatile. Always DYOR. Not financial advice.
Also Read: ZEC Price Prediction: Bullish Breakout Signals an Imminent Rally Toward $480

Be the first to comment