

Solana is one of the best performers among major cryptocurrencies this week, and the price move has usage data and a concrete upgrade behind it rather than just market sentiment.
Key Takeaways
- SOL gained 15% weekly, reclaiming its 50-day average.
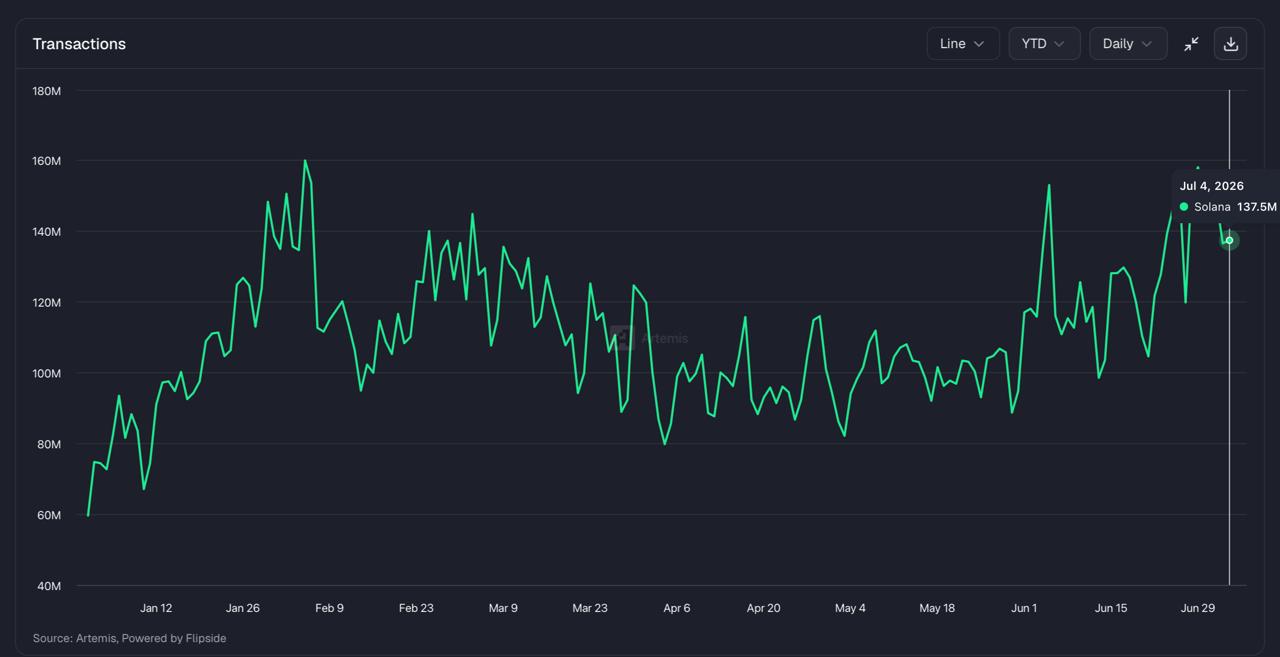
- Daily transactions sits around 137.5 million, near yearly highs.
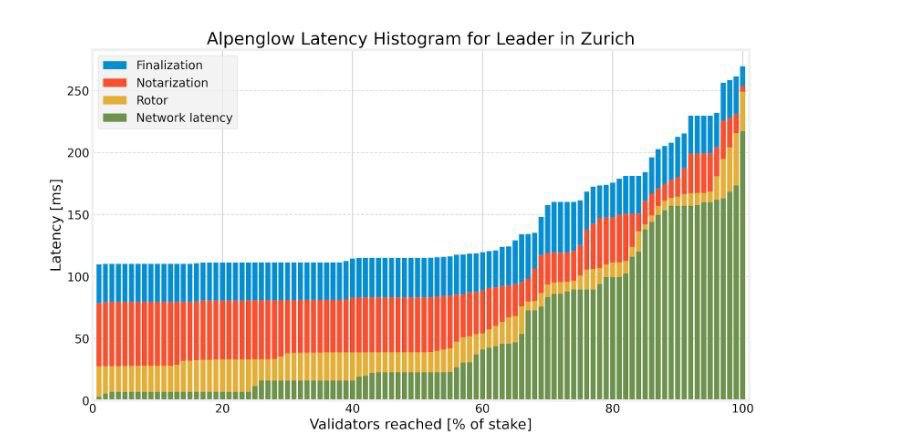
- Alpenglow test data shows finality near 110 milliseconds.
- The 100-day average at $80.54 is the level to watch.
SOL trades at $80.98 at the time of writing after a 15% weekly gain according to CoinMarketCap data, the strongest in the top ten. The bounce started from the June low near $62 and has now done something the March and May rallies could not: it climbed back above the 50-day moving average at $75.31 and is sitting right at the 100-day at $80.54, the line that rejected the last two recovery attempts.
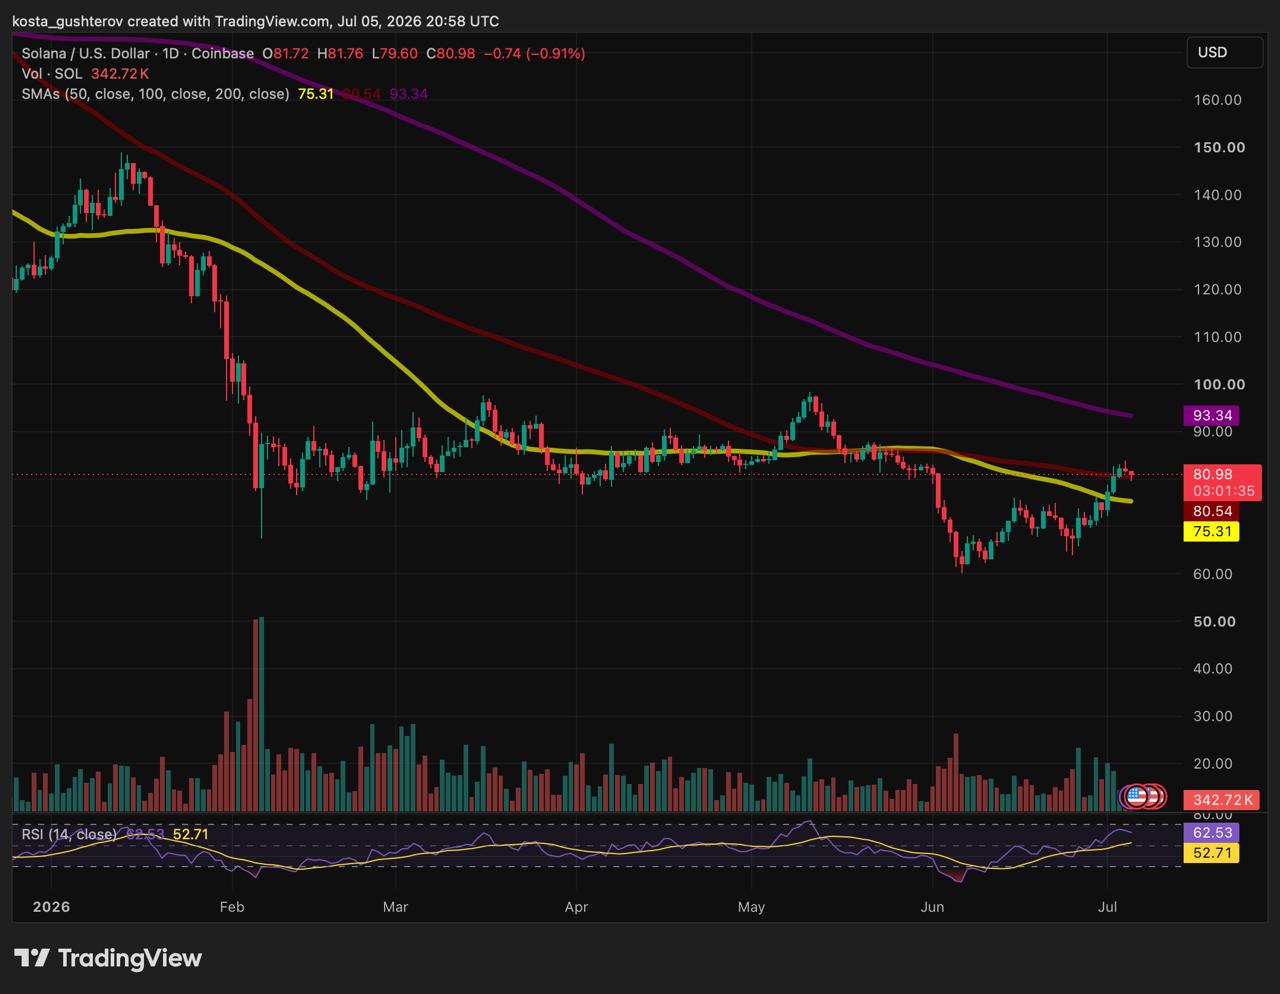
The simple way to read the chart: below $75, the recovery failed. Above $80.54 with a daily close, SOL escapes the zone that has capped it since April, and the next meaningful level is the 200-day average near $93. The momentum gauge (RSI) sits at 62.5, its highest reading of the year, which signals genuine buying pressure but also means the easy part of the bounce is likely behind. SOL remains far below its January level near $150, so this is a recovery inside a down year, not a new high.
The Network Is Busier Than the Price Suggests
Here is the part that separates Solana’s bounce from a generic altcoin pop. Data from Artemis shows the network processed 137.5 million transactions on July 4 after reaching 158 million on 29th of June, close to the year’s highs near 160 million set in February, and sharply up from the 90–100 million range where activity sat through the spring. Usage began climbing in June, before the price did.
That sequence matters. When transactions rise while price falls or stagnates, it means people are using the chain for reasons other than speculation, trading, payments, applications, and when price later catches up, the move rests on real activity rather than pure sentiment. It is the healthiest pattern an on-chain chart can show, though not a guarantee: transaction counts include plenty of low-value activity, so the signal is directional, not precise.
Alpenglow: The Upgrade Behind the Story
The third dataset explains why developers are paying attention. Test results from Alpenglow, the largest upgrade in Solana’s history, show the network confirming transactions for a majority of validators in roughly 110 milliseconds, with even the slowest full-network confirmation near 270 milliseconds. A detailed breakdown by Solana infrastructure firm Helius puts those numbers in context: about 65% of the network’s stake finalizes within 50 milliseconds of the raw network delay, meaning most validators vote almost the instant data arrives, and total finality runs at roughly twice the physical speed limit of the internet itself. In plain terms, the protocol overhead is nearly gone; what remains is mostly the time light takes to cross oceans.
The comparison numbers make the leap concrete. Solana’s current true finality takes about 12.8 seconds, and as TheStreet notes, a typical Visa authorization takes one to three seconds. Alpenglow targets 100 milliseconds when at least 80% of validators respond in the first voting round, and 150 milliseconds on its fallback path, faster than the quickest competing blockchain’s self-reported 400 milliseconds, per Helius.
The upgrade also changes the economics of running the network. Validators currently pay roughly 1 SOL per day in on-chain voting fees, their single largest operating cost. Alpenglow moves voting off-chain, and Helius estimates that eliminating those fees would cut the minimum stake needed for a validator to be profitable from around 4,850 SOL (roughly $800,000) to about 450 SOL (roughly $75,000), a change that could meaningfully broaden who can afford to help secure the network.
Co-founder Anatoly Yakovenko told Consensus Miami the upgrade could reach the main network as soon as this quarter, calling it a pivotal step toward making the chain reliable enough for time-sensitive financial applications. The upgrade replaces two of Solana’s founding technologies with a leaner voting system, and validators approved it with over 98% support.
Not everyone is uncritical. Experts interviewed by The Defiant have questioned whether such speeds are achievable globally without trade-offs, noting that physics itself limits how fast data crosses oceans and that the data-relay design carries real-world unpredictability. The test histogram partially answers this, the speeds hold for most of the network, but the slowest tail is real, and mainnet conditions are harsher than test clusters.
Solana enters July with three things pointing the same direction: the strongest weekly price gain among majors, network usage near yearly highs that started rising before price did, and a dated catalyst in Alpenglow’s targeted Q3 mainnet launch. That alignment is rare in the current market and explains the outperformance. The honest caveats: SOL still trades roughly 45% below its January level, the 100-day average directly overhead has ended two rallies already this year, and upgrade timelines in crypto slip more often than they hold. The next daily close above $80.54, or the failure to get one, could show whether this week was the start of something or the third rejection at the same wall.
This article is for informational purposes only and does not constitute financial or investment advice. Cryptocurrency markets are highly volatile. Always conduct your own research before making investment decisions.

Kosta has reported on cryptocurrency markets and blockchain infrastructure since 2020, bringing over six years of hands-on experience in the crypto industry built through daily tracking of markets, trends, and emerging blockchain developments. Specializing in Bitcoin on-chain analysis, institutional ETF flows, and digital asset price action, his work at Coindoo has been cited by other news agencies and consistently covers market developments with a focus on data-driven reporting across Bitcoin, Ethereum, Solana, and XRP.
Over the years, Kosta has contributed to multiple crypto media outlets in different regions, authoring over 6,000 articles across the sector. His reporting spans cryptocurrency markets and the broader fintech industry, tracking not only price action but also the technological and regulatory forces shaping the ecosystem.
To support his analysis, Kosta actively leverages on-chain data and metrics from leading platforms such as Santiment, Glassnode, and CryptoQuant, enabling deeper, evidence-based market insights. He believes in the power of transparency and the data that underpins the blockchain ecosystem.
His academic background in Marketing Management from Denmark further complements his analytical approach, adding a strong understanding of communication strategy and content positioning to his work.

Be the first to comment