



Here is a technical analysis of ETH/USDT on the daily timeframe:
Market Overview
Ethereum (ETH/USDT) is currently trading around $1,780 on the daily timeframe, extending its recovery from the June lows. The price has successfully broken above the short-term descending trendline that capped the previous rebound, indicating improving bullish sentiment. Despite this progress, ETH is still trading below the 50-day moving average and remains under a major resistance zone around $1,800–$1,850, keeping the broader trend cautiously neutral.
Recent Price Action
Following the rebound from the $1,550 support area, Ethereum continued to form higher lows before breaking above the short-term descending trendline. Buyers have managed to reclaim the $1,700 region and are now attempting to sustain the price above the recent breakout level.
The latest candles suggest consolidation just below resistance, indicating that the market is pausing after the recent recovery while awaiting stronger directional momentum.

Current Structure and Trend
The short-term structure has improved with the breakout above the descending trendline, shifting momentum in favour of buyers. However, ETH still needs a decisive daily close above $1,800–$1,850 to confirm a stronger trend reversal.
Failure to hold above the breakout zone near $1,720–$1,740 could result in a pullback towards immediate support before another attempt higher.
Also Read: ZebPay x KoinX: Simplifying Crypto Tax Reporting for Every Investor
Volume and Momentum
Volume has remained relatively moderate during the recovery, suggesting that buying interest is improving but has not yet reached the strength typically associated with a confirmed bullish reversal. Momentum indicators favour the bulls in the short term, although stronger participation will be required for ETH to challenge higher resistance levels.
At the time of writing, ETH was trading at approximately $1,780.
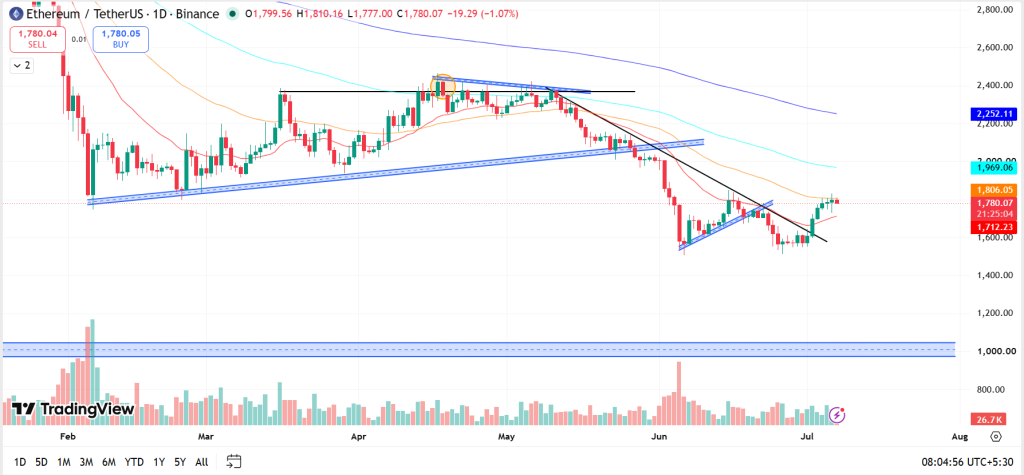
Summary: Ethereum has strengthened its short-term outlook by breaking above its descending trendline and maintaining higher lows following the June recovery. While the immediate bias has turned moderately bullish, ETH continues to face significant resistance near the $1,800–$1,850 zone. The next few sessions will be important in determining whether the current breakout develops into a sustained recovery or encounters renewed selling pressure.
Support and Resistance Levels
| Support 2 | Support 1 | Asset | Resistance 1 | Resistance 2 |
| $1,550 | $1,700 | ETH | $1,850 | $2,000 |
In the grand scheme of things, ZebPay blogs are here to provide you with crypto wisdom. Get started today and join 6 million+ registered users to explore endless features on ZebPay!
Disclaimer:
Crypto products and NFTs are unregulated and can be highly risky. There may be no regulatory recourse for any loss from such transactions. Each investor must do his/her own research or seek independent advice if necessary before initiating any transactions in crypto products and NFTs. The views, thoughts, and opinions expressed in the article belong solely to the author, and not to ZebPay or the author’s employer or other groups or individuals. ZebPay shall not be held liable for any acts or omissions, or losses incurred by the investors. ZebPay has not received any compensation in cash or kind for the above article and the article is provided “as is”, with no guarantee of completeness, accuracy, timeliness or of the results obtained from the use of this information.



Be the first to comment