



Shiba Inu is still under a lot of pressure even though it appears to be stabilizing close to local lows. The meme coin is currently trading at about $0.0000044 after going through a protracted bearish trend for a few weeks, which has largely eliminated the recovery momentum that was observed earlier this year.
For SHIB bulls, the daily chart presents a challenging picture. After supporting price action in March, April, and May, the asset recently broke out of a rising channel. Sellers swiftly regained control after that structure failed, pushing SHIB in the direction of its current range. Even though the token saw a slight increase in value in June, there wasn’t enough volume in the recovery to overcome significant resistance levels.
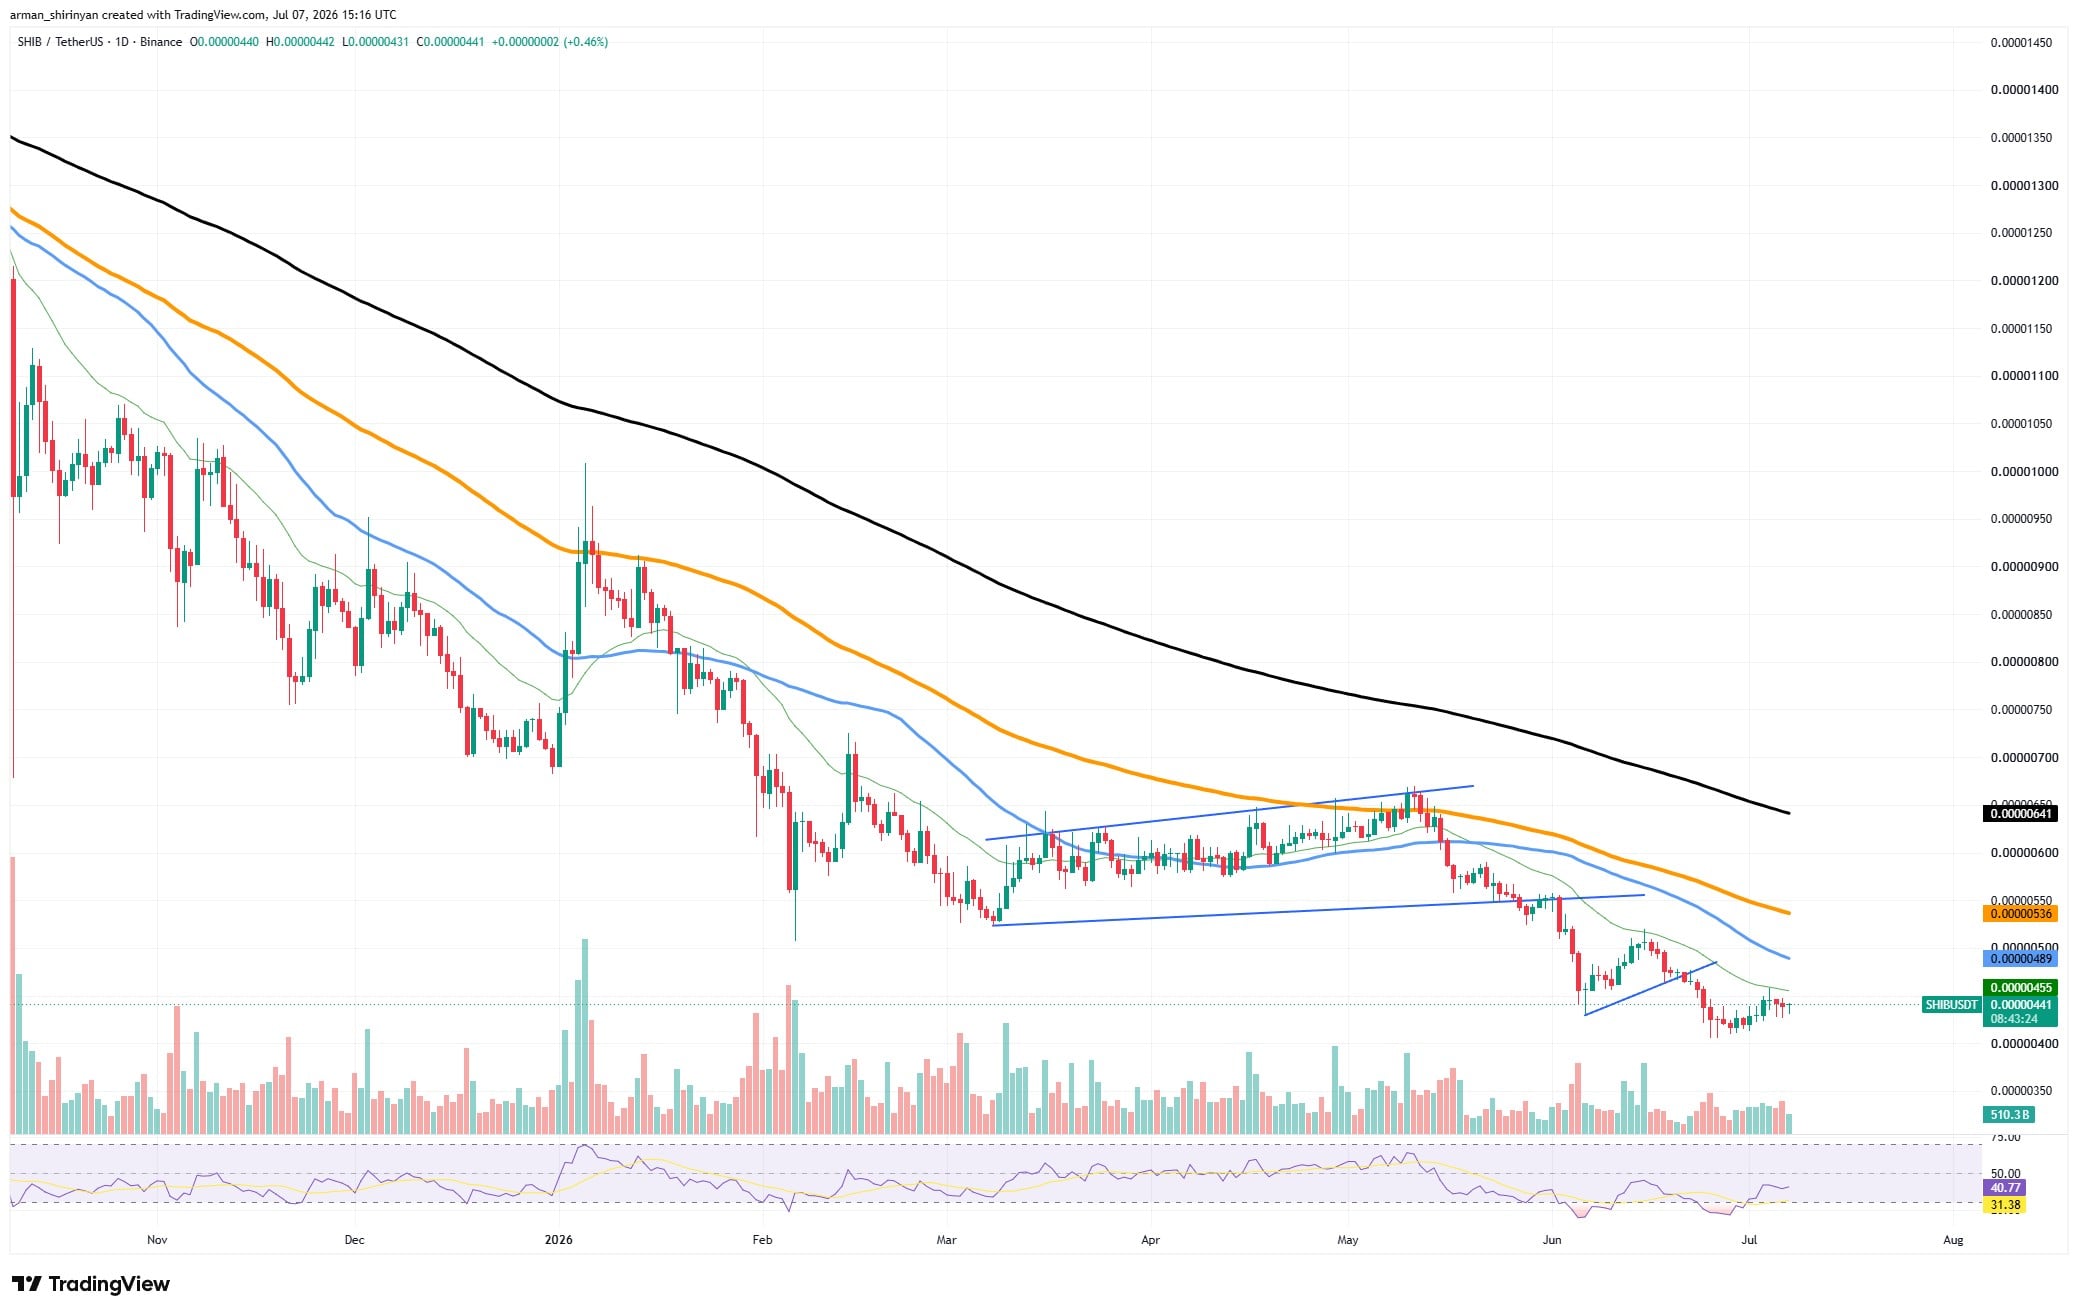
From a technical standpoint, SHIB is still below the 50-, 100-, and 200-day moving averages. This alignment suggests that buyers still have a lot of work ahead of them and is usually linked to a significant downtrend. Stronger barriers still exist close to the 100-day EMA and the declining 200-day trend line, while the closest resistance zone is located around the 50-day EMA. The RSI, which is still close to oversold territory, is one positive indicator.

In the past, when momentum indicators hit such low levels, SHIB has frequently generated relief rallies. Oversold conditions by themselves, however, do not ensure a reversal, particularly when overall market sentiment is still unstable. Instead of initiating a full recovery, SHIB seems to be establishing a temporary base for the time being.
A more significant rebound may occur if buyers are able to sustain support around present levels and progressively raise the price above short-term moving averages. However, the asset would be vulnerable to another downward leg if the recent lows were not held. Whether SHIB is forming a bottom or just pausing before continuing its wider decline will probably be determined over the coming weeks.
Bitcoin’s shallow recovery effort
Following a significant sell-off that pushed the price below a number of crucial support levels, Bitcoin is making an effort to rebound. Although the recent surge has helped Bitcoin return to the $63,000 area, it now faces one of its most significant technical challenges in months. According to the chart, after losing support from a rising trendline that had dominated price action for the majority of the spring, Bitcoin experienced a significant breakdown in June.
Before buyers intervened, the collapse set off a wave of selling pressure that drove Bitcoin down to the low $60,000 region. Bitcoin has since recovered its short-term 50-day moving average, a sign that the bearish momentum is starting to subside. The recovery is still not complete, though. BTC is still below the 100-day and 200-day moving averages, which are located close to $66,000 and $75,000, respectively.
You Might Also Like

Major resistance zones that might draw sellers are represented by these levels. Additionally, during the recovery, volume has stayed comparatively low, suggesting that institutional conviction has not completely returned.
Growing participation is a prerequisite for strong recovery rallies, which is still lacking in the current movement. The RSI is getting close to neutral territory and has greatly recovered from oversold conditions. This change does not yet prove a trend reversal, but it does imply that the worst of the panic selling may be behind us.
The area between $65,000 and $66,000 is the most crucial level to monitor. The bullish case would be strengthened and a wider recovery toward higher resistance levels would be possible with a successful break above that zone. But if Bitcoin doesn’t succeed there, the current trend might just be a relief rally within a bigger bearish structure. For the time being, Bitcoin’s comeback is still viable, but before bulls can declare victory, significant technical challenges must be overcome.
XRP stays cautious
After weeks of intense selling pressure, XRP is making an effort to recover, but the asset has reached a technical crossroads that could dictate its course for the rest of the month. Bulls won their first significant victory since the June breakdown when XRP surged back above the 50-day EMA. In the vicinity of $1.18, the price momentarily rose toward the 100-day moving average, but sellers soon emerged and rejected the move.
Because of this, XRP is still caught between a general bearish trend and rebounding momentum. Technically speaking, the chart still recommends caution. The 200-day moving average is still well above current prices, at about $1.50, while the 100-day EMA continues to serve as immediate resistance. Therefore, despite the recent uptick, the long-term structure is still bearish.
You Might Also Like

An encouraging indication is that momentum has improved. Panic selling has mostly stopped, as evidenced by XRP’s RSI rising from oversold territory and getting closer to the neutral zone. Additionally, volume has increased during the recovery attempt, indicating that buyers are at least prepared to defend recent lows. Whether XRP can turn this bounce into a real trend reversal is the crucial question.
The bullish case would be greatly strengthened by a daily close above the 100-day EMA, which would also pave the way for the $1.28 area, where the 200-day trend resistance starts to become apparent. However, another decline toward the $1.05–$1.08 support zone could occur if the current resistance is not overcome.
For the time being, XRP is more resilient than it was for the majority of June, but before a more significant recovery can be verified, bulls still need a clear breakout.
Solana expresses strength
After regaining several significant technical levels during its recent recovery, Solana is one of the few major cryptocurrencies exhibiting observable signs of strength. SOL has recovered above its 50-day and 100-day moving averages after a protracted decline. Right now, the asset is trading close to $81 and is consolidating just below a sizable resistance area between $82 and $85. This region served as support prior to the market-wide sell-off in June, but it now poses the biggest obstacle for buyers.
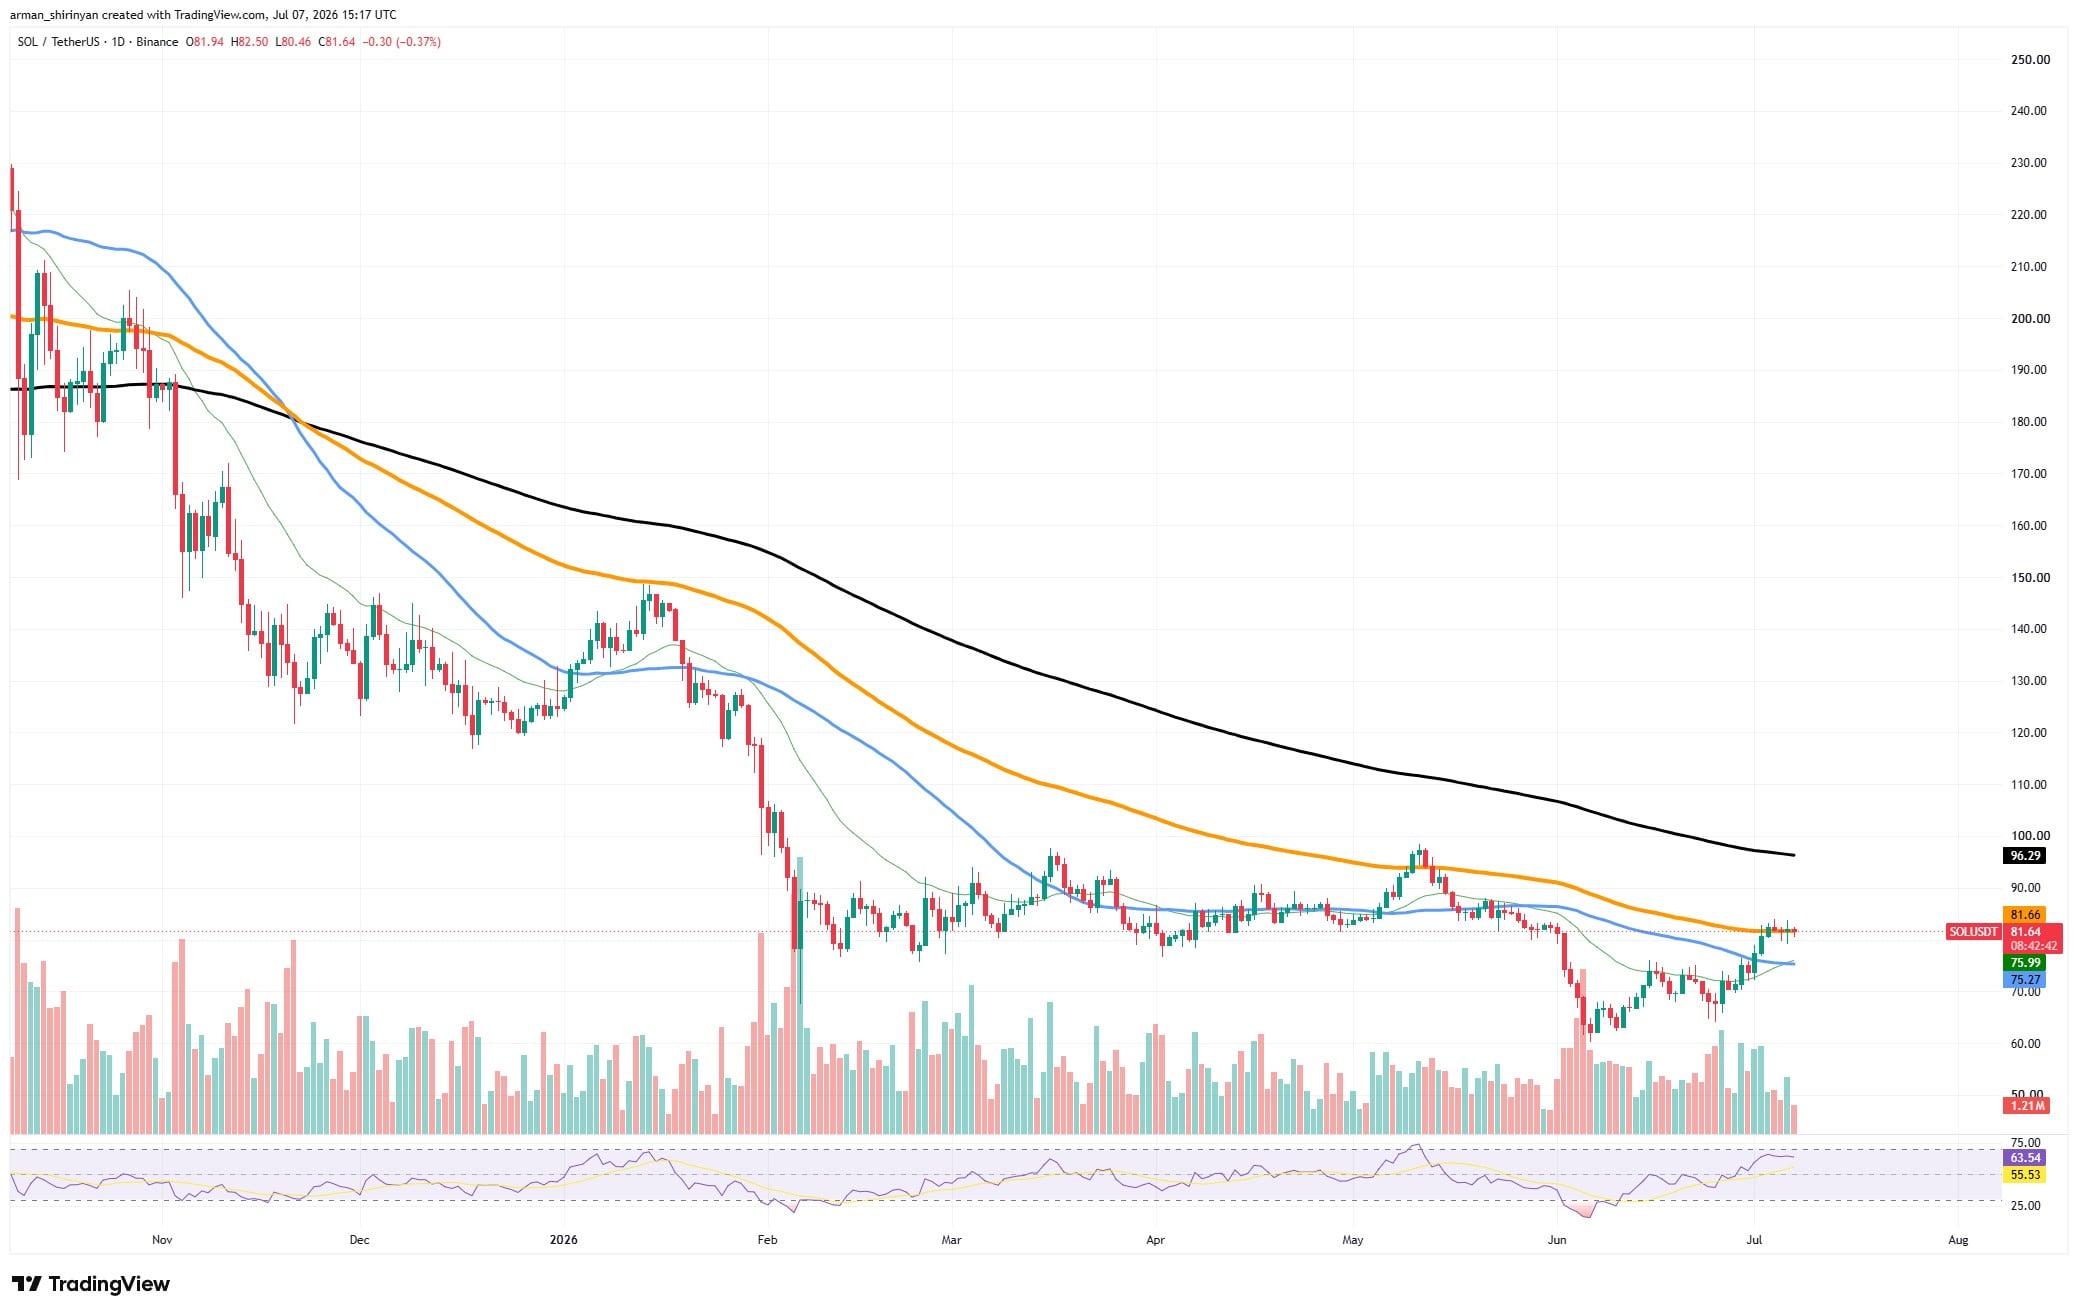
Since the June bottom, Solana has established a series of higher lows, in contrast to many altcoins that are still stuck below short-term resistance. This suggests that buyers are progressively taking back control of the market structure. Additionally, momentum indicators confirm the improving outlook.
The RSI has risen above 60, indicating increasing buying pressure that has not yet reached overbought levels. In the past, readings within this range have frequently coincided with the initial phases of more robust recovery rallies. The breakout above the moving averages has more credibility because volume has increased during the rise.
You Might Also Like

Thin liquidity was not the cause of the recent spike; rather, a discernible rise in market participation was. A clear move above the $85-$90 range is the next goal for bulls. The 200-day moving average around $96 would come into focus with a successful breakout there, and it might also mark the start of a more significant trend reversal.
Nonetheless, traders shouldn’t disregard the potential for a brief decline. Solana has recovered significantly from its June lows, and it would be typical to take profits close to resistance. The recovery structure is unaffected as long as SOL stays above its recovered moving averages.
Solana currently has one of the best technical setups of any major altcoin, but before the bear trend can be deemed completely broken, it still needs to get past long-term resistance.


Be the first to comment