



Oil just grabbed the steering wheel again. One weekend of headlines out of the Strait of Hormuz, and suddenly everyone who was trading chips and AI multiples is back to watching Brent ticks and gasoline spreads.
This isn’t the 1970s, but energy shocks still punch through growth stocks, inflation expectations, and rate paths. The timing is awkward too, with equities priced for immaculate disinflation and a clean landing.
Let’s walk through what changed, how it filters into the S&P 500, what to watch in the next few weeks, and where the trapdoors sit if this escalates.

| Point | Details |
|---|---|
| New Hormuz flashpoint | U.S. forces struck Iranian targets on July 7 after attacks on commercial vessels, raising fresh supply risk in a critical oil chokepoint Al‑Monitor. |
| Policy shift on Iranian oil | U.S. Treasury revoked a general licence for Iranian crude sales following tanker strikes, with a wind‑down period reported July 8 bne IntelliNews. |
| Oil reprices fast | Brent settled up about 3% on July 7, then pushed near $78 the next day as truce doubts mounted MarketScreener, StreetInsider. |
| Equities wobble | S&P 500 fell about 0.45% on July 7 as higher oil and chip weakness hit risk appetite MarketScreener. |
| Inflation risk repricing | Energy shocks lift headline CPI and can leak into core via transport and goods costs, pushing out rate cut timelines. |
What just happened in Hormuz
The short version: tensions jumped. U.S. Central Command said American forces carried out strikes on July 7 in response to Iranian attacks on three commercial vessels moving through the Strait of Hormuz Al‑Monitor. Washington then yanked a general licence that had allowed certain Iranian crude sales, setting a wind‑down period and tightening the screws on barrels that had been slipping through bne IntelliNews.
Futures didn’t wait. Brent settled up $2.17 on July 7 to $74.16, with WTI up $1.89 to $70.44 as traders marked up supply risk MarketScreener. Then the move extended the next morning, with Brent touching about $77.98 after renewed escalation headlines questioned any truce narrative StreetInsider.
Stocks flinched. The S&P 500 closed down roughly 0.45% on July 7 to 7,503.85, with chip names leading the slip and oil’s jump doing the rest MarketScreener. It was a reminder that AI multiples still live inside a macro world where fuel costs and freight premiums matter.
How an energy jolt filters into inflation
Energy rolls through inflation in layers. First, headline CPI reacts quickly to gasoline and heating fuel. Gasoline alone is typically a mid single digit share of CPI by weight, so a meaningful pump price move can bend the monthly print even if core is behaving.
Then there’s the second round. Higher diesel and jet fuel feed into freight, airfares, and delivery costs. That stuff bleeds into goods prices with a lag. If companies see higher input costs and feel they have pricing power, they try to pass some of it through. If demand is soft, they eat margin instead. The mix is cyclical.
Monetary policy cares more about core, but central banks also know headline can reset consumer expectations. A few hot months of headline prints can nudge 1-year inflation expectations higher, which can complicate the case for quick rate cuts.
Put bluntly: a fast oil spike at a time when markets are positioned for clean disinflation increases the odds of a stickier path. That doesn’t mean the Fed hikes. It can simply mean cuts are slower or fewer, which is enough to move equities.
What the equity tape is pricing right now
Breakevens, reals, and multiples
Equity valuations have been floating on a mix of soft-landing growth and easing financial conditions. If oil drags breakeven inflation higher, and real yields hold firm or push up, the duration trade in growth stocks gets harder. You see it in days like July 7, where semis lag while energy and defensives catch a bid.
Curves and leadership
A sticky inflation scare tends to flatten front-end expectations for cuts. The curve can steepen out the back if growth fears set in. That stew usually rotates leadership toward energy, utilities, some quality value, and away from high duration tech. It doesn’t erase AI capex, it just right-sizes the multiple while cash flows get discounted at a slightly higher real rate.
Liquidity and vol
Oil shocks can lift cross-asset volatility quickly. Watch skew in energy ETFs, vol of vol in equity index options, and liquidity pockets thinning in small caps. These are the days when a shallow book makes moves look bigger than they are. If you trade with stops, give yourself breathing room or define risk with options so a wick doesn’t knock you out.
Who wins, who loses on the S&P 500
| Group | Sensitivity to oil shock | Why |
|---|---|---|
| Energy producers & services | Positive | Higher realized prices, tighter supply, potential margin expansion if costs lag. |
| Midstream & storage | Mixed to positive | Volumes and storage spreads can improve if backwardation steepens, but outages can cap flows. |
| Airlines, shippers, logistics | Negative | Jet and diesel costs jump; war risk premiums and insurance add-ons pinch margins. |
| Chemicals & industrials | Negative | Feedstock costs rise, pricing power varies by cycle; margins can compress. |
| Consumer discretionary | Negative | Fuel eats into household wallets, especially for lower income cohorts. |
| High duration tech | Negative via rates | Valuation multiples wobble if breakevens rise and real yields firm. |
| Utilities | Defensive bid | Can act as bond proxies when growth and inflation risks hit at once. |
Pro tip: If you want energy exposure without single-name risk, compare ETF mixes. XLE is mega-cap integrateds, XOP tilts to producers, OIH leans services. Their sensitivity to spot vs. activity cycles is not the same.
Positioning ideas with defined risk
Not advice. It’s a menu. Size to your plan and be aware of leverage.
- Look at call spreads on energy ETFs. If oil keeps squeezing and equities chop, vertical call spreads in XLE or XOP can express upside without paying top-of-book implied vol.
- Think about collars on broad equity exposure. Own stock or SPY? A short-dated put spread financed by an out-of-the-money call can soften a shocky week without selling the position.
- Breakeven expressions. TIPS breakevens tend to widen when oil pops. Some traders express this through TIPS ETFs versus nominals. The risk is that growth scares pull real yields up too, which can blunt the trade.
- Calendar hedges around data. If you expect oil to feed into headline CPI, owning optionality across the print dates helps. Strangles can be expensive, so compare implied vs. realized and consider ratio spreads.
- Beware levered oil ETFs. Products that reset daily can decay quickly in choppy markets. If you need leverage, option structures are often cleaner.
Options can lose all their value. Futures can move against you faster than you can refresh a chart. Understand margin and gap risk before you lean in.
The crypto angle: inflation and oil
Crypto sits in a weird place during oil shocks. Sometimes Bitcoin trades like macro beta, selling off when real yields jump and the dollar firms. Other times it acts like a geopolitical hedge when headlines get loud and people reach for non-sovereign assets. Correlation regimes change. You can see both behaviors in the same month.
Two things to keep in mind:
- Rates path still dominates. If an oil spike nudges inflation expectations higher and delays cuts, higher real yields can weigh on Bitcoin and long-duration tech at the same time. That’s the 2022 playbook peeking through.
- Energy cost matters for miners. If your business turns electricity into hash, fuel and power costs ripple through margins. Miner equities can detach from BTC during energy squeezes.
Stablecoin plumbing can also feel it. Higher oil receipts routed through shadow channels typically show up in cross-border dollar demand. With the U.S. leaning harder on Iranian barrels after the licence revocation bne IntelliNews, watch for more friction in grey-market settlement routes. It’s messy, but it does affect how offshore dollar liquidity ebbs and flows, and crypto sometimes reflects that stress.
Scenarios to watch over the next 30 days
De-escalation with noisy patrols
- Oil retraces part of the spike but holds a risk premium. Time spreads relax.
- S&P rotation fades. Mega-cap tech steadies as cut expectations re-anchor.
- TIPS breakevens cool. Real yields drift. VIX bleeds lower.
Stop-and-go disruptions
- Sporadic incidents keep war risk premiums elevated. Insurance and day rates stay rich.
- Headline CPI stays choppy. Equities grind sideways with factor whiplash.
- Energy leadership persists, but beta is hard to hold. Options carry matters.
Material supply shock
- Sustained flow interruptions or tougher sanctions shrink export availability.
- Brent backwardation steepens. Gasoline cracks stay bid into driving season.
- Fed cut timelines slip. Growth stocks de-rate. Defensives and energy factor outperform.
- Gold and the dollar can rally together. Bitcoin’s path depends on whether rates or risk-off dominates that day.
Pro tip: Scenario plan in advance. Decide which indicators flip you from one playbook to another, and write them down. In a headline tape, you won’t have time to debate your own rules.
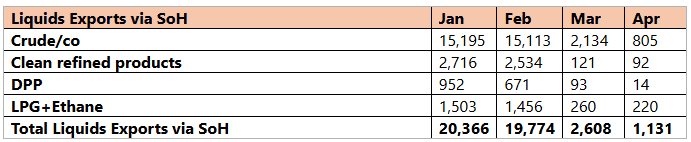
Kpler chart showing Strait of Hormuz flows collapsing from ~20 million barrels/day pre‑war to ~1 mbd in April and the components of market ‘rebalancing’ — it quantifies the supply shock that underpins the oil shock and inflation repricing risk. — Source: Kpler
Check the right data each morning
- Front-month Brent and WTI, plus the nearest calendar time spread. Steep backwardation says supply tightness.
- Gasoline and diesel crack spreads. They tell you about downstream stress and consumer pinch.
- EIA weekly petroleum status. Inventories and refinery runs matter for whether the spike sticks.
- Breakeven inflation and 5y5y forwards. If breakevens are widening faster than oil justifies, equities will notice.
- Fed-dated OIS or CME’s FedWatch. Watch how many cuts the curve prices and how quickly that changes.
- Sector breadth in the S&P 500. If energy is green and everything else is red, your problem is macro, not stock-picking.
- VIX, MOVE, and skew. Stress shows up in tails first.
- ETF flows into XLE, XOP, OIH, USO. Follow the money to see if rotation is sticky.
How this can go wrong
Three common mistakes:
- Chasing after the third headline. The first move can be right for the wrong reason. If positioning was offside, the unwind can overshoot. Let the tape prove it.
- Ignoring currency. If the dollar rips higher on safe haven demand, it can offset some commodity inflation and add pressure to non-U.S. earnings.
- Over-hedging. Paying too much for protection right after a vol spike is a good way to bleed. Consider spreads or longer tenors where vol is cheaper.
And one risk that’s easy to miss: sanctions often shift barrel flows rather than erase them. If alternative routes absorb displaced crude faster than expected, the oil risk premium can deflate quickly and leave late hedges stranded.
What to watch on the policy front
Policy moved already. The U.S. revoked a general licence enabling some Iranian oil sales after three tankers were struck in Hormuz, with the change reported on July 8 bne IntelliNews. If enforcement tightens, barrels that had been discounted and moving quietly may slow. Also keep an eye on coordinated responses with allies, shipping advisories, and insurance carve-outs. If war risk premia on transit or coverage get pulled, freight costs jump and flows detour, which is inflationary at the edges even if outright supply is okay.
The other policy watch is the Fed’s reaction function. Officials will look through one-off energy spikes, but not if they alter inflation expectations or wage bargaining. The next few CPI and PCE prints will tell you if the oil pop is noise or a new floor under headline.
If you want a rolling view of how crypto and macro are learning to share a stage again, we cover it daily at Crypto Daily without the fluff.
Frequently Asked Questions
Why do oil spikes hit the S&P 500 so fast?
Because they move inflation expectations, rate paths, and costs at the same time. Markets discount all three. Energy stocks may rally, but higher discount rates and margin pressure usually weigh on the broader index.
Does the Fed react to oil or ignore it?
It focuses on core inflation, but a big move in headline that shifts expectations or bleeds into transport costs can slow the pace of rate cuts. One hot month is noise. A few in a row change the debate.
How important is the Strait of Hormuz to oil supply?
It is one of the most important chokepoints globally. Disruptions or higher transit risk can tighten effective supply and lift prices quickly, even if no barrels are physically lost right away.
What sectors usually benefit from an oil shock?
Integrated oil, exploration and production, and oilfield services tend to benefit. Some defensives like utilities can find support if growth jitters rise. Airlines, shippers, chemicals, and consumer discretionary typically struggle.
Is Bitcoin an inflation hedge during oil shocks?
Sometimes yes, sometimes no. When higher real yields drive the tape, Bitcoin can trade like risk assets and sell off. If geopolitical stress dominates and the dollar is mixed, it can behave more like a hedge. Regime matters.
How long does it take for oil to show up in CPI?
Gasoline affects headline quickly, often within a month. Second-round effects into goods and services can take a few months and depend on demand, contracts, and pricing power.
What is the cleanest way to hedge portfolio oil risk?
There is no perfect hedge. Many investors prefer defined-risk option structures on energy ETFs or consider small breakeven exposures. Futures and levered ETFs carry higher operational and gap risk.
Disclaimer: This article is provided for informational purposes only. It is not offered or intended to be used as legal, tax, investment, financial, or other advice.




Be the first to comment