



Ethereum trades at $1,750 after rejecting a $1,787 confluence of the 50 SMA, horizontal resistance, and 0.236 Fibonacci retracement, while today’s daily close might be set to frame the next directional move.
Key Takeaways
- ETH trades at $1,750, down 1.10% intraday after tagging a $1,783 high.
- 50 SMA at $1,787, horizontal resistance, and 0.236 Fib near $1,787 overlap.
- Price sits below the 50, 100 ($2,024), and 200 SMAs ($2,245).
Why the $1,787 Rejection Carries Weight
Ethereum’s recovery from the $1,505 June low stalled at the exact price zone where three independent technical inputs converge. The 50-day SMA sits at $1,787, the horizontal supply shelf sourced from prior June consolidation aligns within the same handle, and the 0.236 Fibonacci retracement of the $2,465 to $1,505 decline plots at approximately $1,787. Confluence of this density typically produces the market’s first meaningful reaction on a counter-trend rally, and the current daily candle is testing whether that reaction holds.
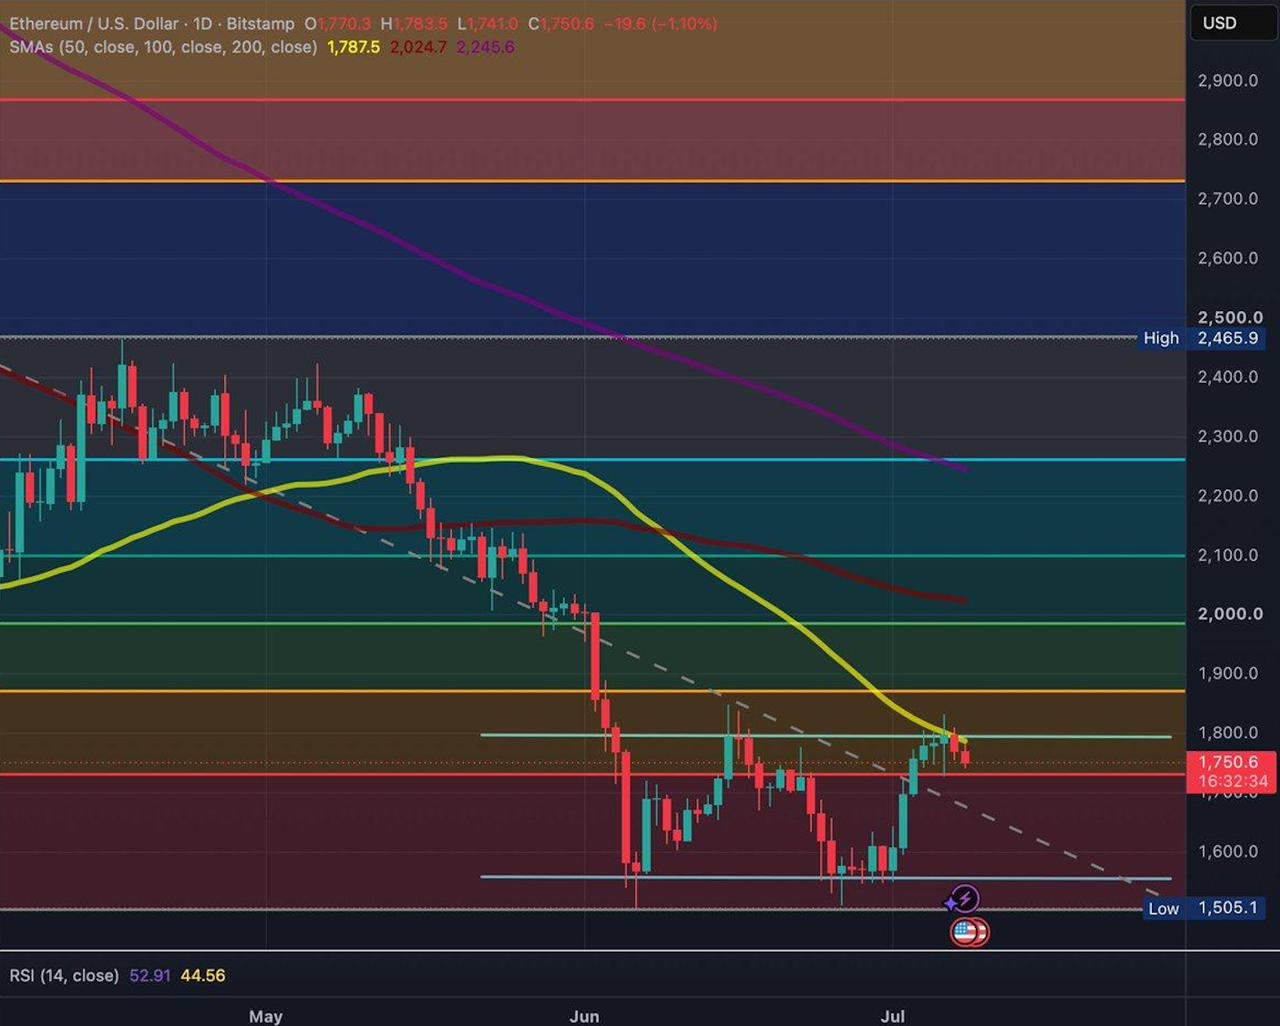
The structural read remains bearish until reclaimed. Price has traded beneath the 50 SMA throughout the June sell-off, and the 100 and 200 SMAs sit $274 and $495 above spot respectively, an alignment that historically defines distribution rather than accumulation regimes. RSI at 52.91 sits in neutral territory, offering no directional edge and confirming that momentum has not yet resolved the range.
Technical Deep-Dive
- Moving average structure: ETH’s daily chart on Bitstamp shows the 50 SMA ($1,787) sloping downward and acting as dynamic resistance. The 100 SMA ($2,024) and 200 SMA ($2,245) preserve the bearish stack, meaning any reclaim of $1,787 opens a technical path only to the next SMA overhead, not an immediate trend reversal.
- Fibonacci reference: Measured from the $2,465 swing high to the $1,505 swing low, the 0.236 retracement plots near $1,787, the 0.382 near $1,872, and the 0.5 midpoint near $1,985. The 0.236 is statistically the shallowest retracement level and its rejection often signals that sellers retain control of the broader swing.
- Range floor: The $1,505 low aligns with the horizontal support that capped the June range base. A daily close beneath the $1,700 handle could place that level back in play as the next mechanical downside reference.
What Traders Could Be Watching
- Bearish confirmation path: A daily close below the $1,787 confluence confirms the rejection. A subsequent break under the 0.236 Fibonacci near $1,787 followed by a retest of that level as resistance offers a structurally cleaner short entry than fading the wick in real time.
- Bullish invalidation path: A daily close above $1,787 that reclaims the 50 SMA shifts the short-term structure. Historically, entering on a retest of a reclaimed level as support has produced better risk-reward than chasing the breakout candle itself, because failed breakouts remain the dominant outcome when price trades beneath a downward-sloping 200 SMA.
Risks That Traders Should Price In
The setup carries three specific execution risks. First, confluence zones can absorb multiple tests before resolving, and a single rejection candle is not statistically sufficient evidence of a directional outcome. Second, the 0.236 Fibonacci is the weakest of the standard retracement levels and price often slices through it toward the 0.382 near $1,872 without producing a durable rejection. Third, macro catalysts and spot ETF flow data can override technical setups on any given session, particularly when RSI sits mid-range and neither side holds momentum.
The information provided in this article is for educational and informational purposes only and should not be construed as financial advice. Cryptocurrency investments carry significant risk, and readers are encouraged to conduct their own research and consult with a qualified financial advisor before making any investment decisions.

Alex is Editor-in-Chief of Coindoo and co-founder of Millennial Media Group, with nearly a decade of experience covering financial markets – crypto first, then everything else.
It started in 2016 with Bitcoin. Like most people at the time, he didn’t fully understand it – so he kept digging. Blockchain, tokenomics, the projects, the cycles. That curiosity never stopped, and eventually pulled him into traditional markets too: equities, commodities, macro. Not because he left crypto behind, but because you can’t properly understand one without the other.
What drives him is straightforward: he wants to know why something is happening, not just that it’s happening. Most market coverage stops at the headline – price up, price down, here’s a chart. Alex finds that kind of reporting actively unhelpful. If you walk away from an article without understanding the mechanism behind the move, what did you actually learn?
He holds a degree in Tourism from New Bulgarian University – not the most obvious path into financial markets, but markets have a way of pulling in people who are simply too curious to stay out. He has authored over 200 in-depth analyses and more than 10,000 articles across crypto and traditional finance. He still thinks every day in markets teaches him something new. That’s probably why he hasn’t stopped.


Be the first to comment