




TLDR
- Solana FUD reached its highest level of 2026 as trading volume hit its lowest point this year
- SOL is testing a major resistance zone between $79 and $85 where 105 million SOL changed hands
- Breaking above $85 could open the path to $100, then $127; rejection risks a drop to $53 or lower
- Despite weak price sentiment, Solana’s Q2 network activity was strong across all key metrics
- Analyst Michaël van de Poppe says holding $73–$76 is critical for any push above $100
Solana is facing its highest fear, uncertainty, and doubt levels of 2026. At the same time, trading volume has dropped to its lowest point this year, according to blockchain analytics platform Santiment.
The mood among traders has turned cautious. Many have grown frustrated after SOL failed to match price expectations, despite attention around tokenized stocks and real-world assets on the network.
Santiment noted that when negative sentiment and low trading volume combine, it can sometimes reduce selling resistance. That creates conditions where large buyers can step in with less pushback.
✍️ TL;DR: Solana FUD hits highest point of 2026, generally a bullish sign
📊 Metrics Used: Trading Volume, Negative Sentiment
🔗 Link to chart: https://t.co/3d3XHYAsY3😬 Solana is getting hit with a rough sentiment combo: trading volume has fallen to its lowest level of 2026,… pic.twitter.com/e020pDoOJ9
— Santiment Intelligence (@SantimentData) July 9, 2026
Analyst Michaël van de Poppe weighed in on X, saying that if SOL holds between $73 and $76 and bounces, it would be a strong signal that the market is ready to push above $100. He warned that failure to hold that range could lead to new lows across the board.
Things start to become interesting here for $SOL.
If it is able to hold between $ 73- $ 76 and bounce back upwards, it is a strong signal that the markets are ready to run to higher than $100.
If that doesn’t happen, boy, we’ll be seeing new lows across the board. pic.twitter.com/XRz4iMfxY6
— Michaël van de Poppe (@CryptoMichNL) July 8, 2026
SOL Faces a Major Supply Wall
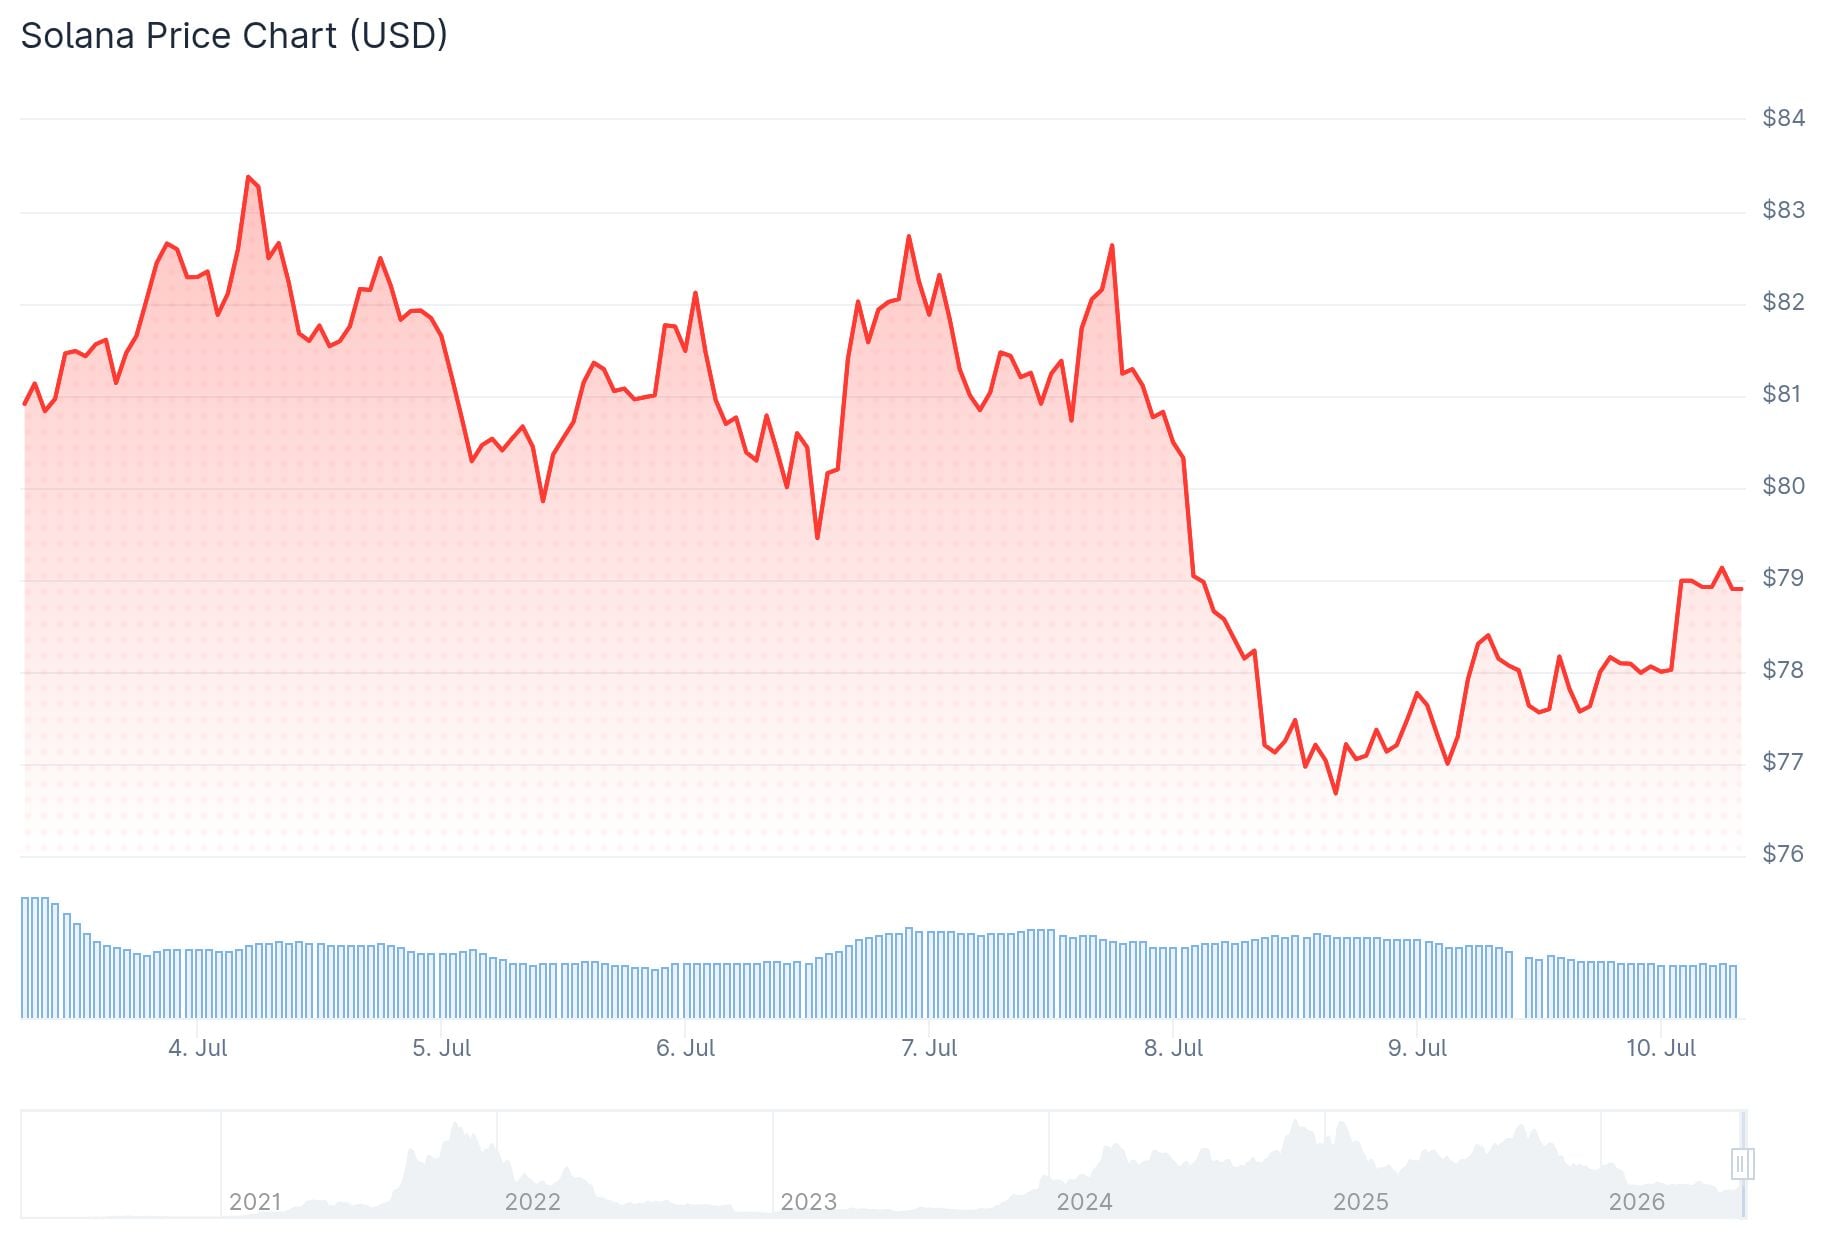
Analyst Ali Charts highlighted that roughly 105 million SOL changed hands in the $79–$85 range. That makes it a heavy resistance zone, as many holders near breakeven may look to sell.

SOLANA: BIG SUPPLY WALL
Solana is currently attempting to reclaim a resistance zone between $79 and $85.
According to URPD data, roughly 105 million SOL were transacted within this range, establishing a dense supply cluster.
Reclaiming this zone as support clears the overhead… https://t.co/CZXB9kPtOz pic.twitter.com/jiZI3GJ8z4
— Ali Charts (@alicharts) July 8, 2026
If buyers push SOL above $85 and hold that level as support, the next targets are $100 and then $127. A rejection there could send the price back toward $53, with deeper support sitting between $45 and $36.
Analyst Astekz also flagged the $45.60 and $36.64 levels as key downside targets if SOL loses its current range.
Strong Network Activity Behind the Price Weakness
Despite the bearish sentiment, Solana’s Q2 on-chain data told a different story. The network processed around 100 million daily transactions. Daily active addresses averaged 1.93 million, and daily DEX volume hit $2.09 billion.
Decentralized applications on Solana generated $262 million in revenue during Q2. That marked the ninth straight quarter where Solana ranked first among blockchains in Web3 app revenue, accounting for 41% of the total.
Real-world assets on the network grew from $2 billion in March to over $3.48 billion by July. Stablecoin volume reached $1.79 trillion in June, up 63% from May.
Pump.fun brought in $91.43 million during Q2. Early July also saw the first week with over one billion non-vote transactions on the network.
SOL is currently caught between strong on-chain fundamentals and cautious trader sentiment, with the $79–$85 supply wall the key level to watch.



Be the first to comment