



What to know:
- Analysts see signs that Dogecoin may be completing a long-term bottom.
- The $0.070–$0.073 area remains the key support zone for bulls.
- A move above $0.095–$0.100 could open the way toward higher targets.

Could Dogecoin be preparing for another major trend shift? The memecoin has spent a long period under selling pressure, but several technical signals now suggest that buyers are gradually returning to the market.
If the current recovery structure continues to strengthen, it could mark the beginning of a new accumulation phase and potentially change sentiment around one of the cryptocurrency market’s most closely watched tokens.
Early Recovery Signals Emerge for Dogecoin
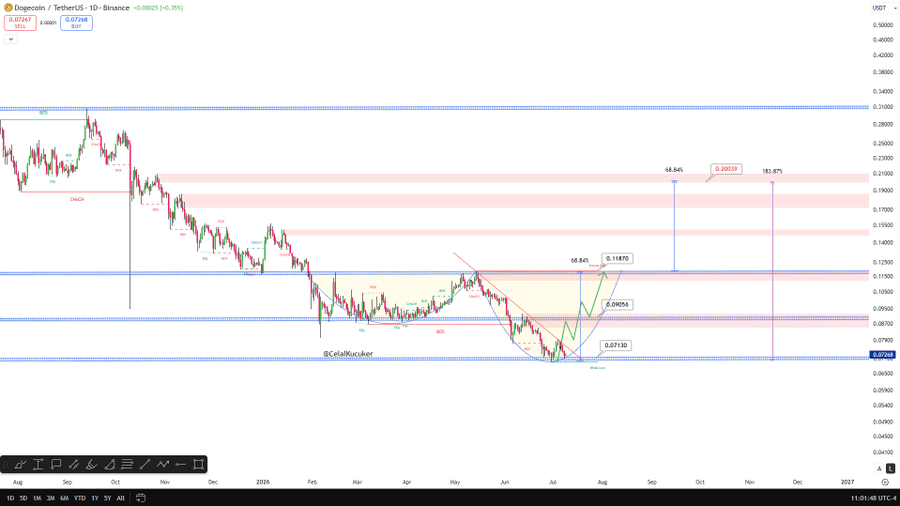
Dogecoin appears to be getting back on its feet following months of declines. According to market expert Celal Kucuker, the coin may be setting up for a double-bottom setup, which can be followed by a sudden surge if proven to be valid.

This follows Dogecoin’s current price staying above the long-term support zone of $0.070 to $0.073. In the daily chart, there is a rounding bottom pattern and a breakout above the resistance downtrend line. The successful test after the breakout shows the pressure to sell is reducing, and the long-term investors are buying again.

Also Read: Bank of Korea Backs Bank-Led Won Stablecoins as Bill Faces Delays
Neckline Break Holds the Key
Another bullish formation seen is the inverted head and shoulders. The confirmation of the formation will occur once DOGE makes a move beyond the neckline at $0.095 to $0.100. This will mark a change in momentum since a sustained downward trend began in late 2025.
First, Fibonacci targets have set the primary target in the range between $0.118 to $0.120, reflecting around a 69% return from the existing support level.
If buying continues at its best pace, the next significant target will be around $0.200 to $0.203, which previously was the level of heavy supply.
Long-Term Cycles Offer Further Encouragement
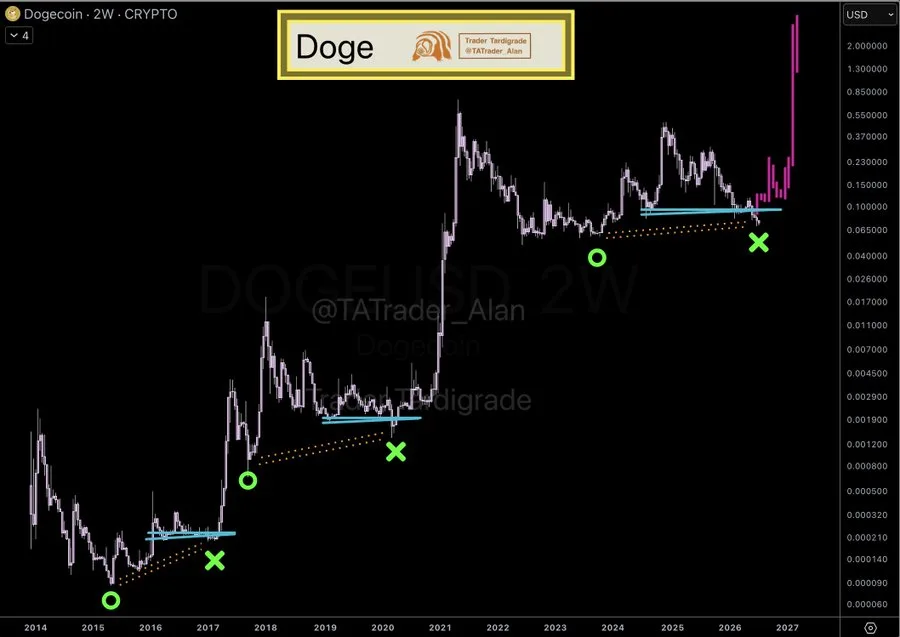
According to Trader Tardigrade, the chart for the last two weeks is almost identical to those preceding major surges in Dogecoin prices in 2017 and 2021.
Both occasions saw DOGE spending a significant amount of time trading above an uptrending support level prior to the breakout and subsequent surge in price. Currently, the chart is identical, with DOGE returning above the range of $0.10–$ 0.12, which serves as the key technical base level.
Derivatives Data Show Caution After Liquidations
The short-selling activity is still controlled. According to the analyst CW, there was short covering in BitMEX, but the price continued its decline even after closing these positions; thus, it can be assumed that large players are influencing the current movement.
The open interest sharply declined in the period of the July 8 selling-off, and the volume of trading operations remains low. DOGE is currently trading at $0.074. Resistance levels are at $0.075-$0.076 and at $0.078-$0.079, respectively.

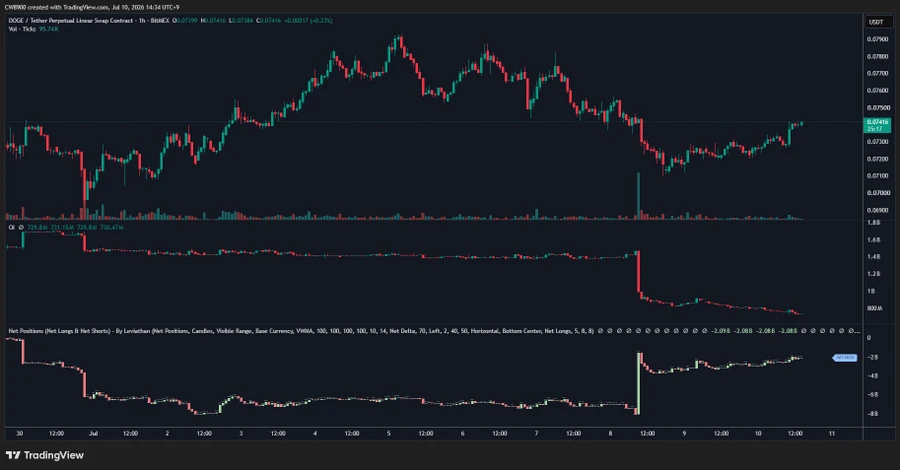
Currently, there is a bullish trend seen from Dogecoin, and an upward correction could be expected provided that the level of $0.070 is held.
Will Broader Market Sentiment Shape DOGE’s Next Move?
Looking ahead, there appears to be a pivotal point for Dogecoin in the making. Investors will be watching carefully to see whether Dogecoin can maintain its support levels and continue advancing further.
In case the level of buying interest increases and it manages to breach the major resistance levels, there may be an improvement in the trajectory for the meme token, moving from the sideways trend to a wider recovery phase.
Also Read: Robinhood Chain Hits $563 Million Uniswap Volume
This article contains market analysis and price predictions. These are not guarantees. Crypto markets are volatile. Always DYOR. Not financial advice.


Be the first to comment