



What to know:
- XLM forms a long-term bullish structure with higher lows and accumulation signals.
- Analysts watch resistance levels for a potential breakout toward higher targets.
- Stellar’s expanding RWA ecosystem strengthens its long-term outlook.

Stellar’s native token, XLM, is drawing renewed attention from market analysts as its long-term chart structure points toward a potentially major move. Analyst Celal Kucuker described XLM as one of the cleanest charts in the cryptocurrency market and suggested that a rally toward $2.50 would not be surprising if the current setup remains intact.
Stellar is trading within a long-term ascending triangle that has formed since the 2021 peak, a pattern often seen as bullish. XLM has also posted a series of higher lows over recent years, suggesting buyers are entering the market at progressively higher prices.
Also Read: Wall Street Banks Restrict Employees from Trading on Prediction Markets

Higher Lows Signal Continued Accumulation
From the technical standpoint, XLM is trading near the 0.786 level of Fibonacci Retracement at $0.21, and the rising trendline support is at $0.157. It is viewed as highly significant due to the convergence of trendline support and Fibonacci Retracement levels.
Maintaining above the existing support will ensure the continuation of the XLM uptrend. The price has been printing higher lows, indicating increased buying pressure and reduced selling pressure. The main obstacle is the extended resistance line that has been under attack for a Vlong time.
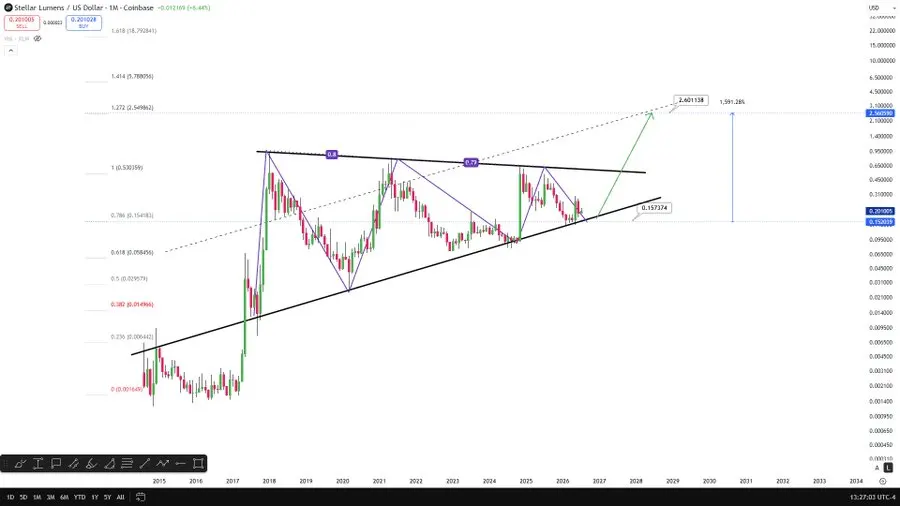

However, those attacks have weakened recently. In case the price breaks above this level with increased volume, the target may be the 1.272 Fibonacci extension at $2.60, which implies a gain of 1,591%.
Weekly Trend Still Needs Confirmation
Another market analyst, known as The Boss, said Stellar’s long-term structure is improving but warned that a full trend reversal has not yet been confirmed. In the weekly chart, the trend is still bearish. Recently, the coin did not manage to go above the major resistance between $0.25 and $0.26 and started going down once again.
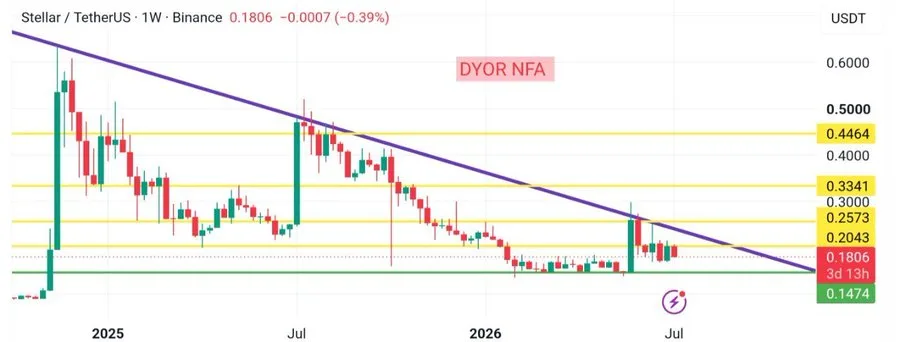
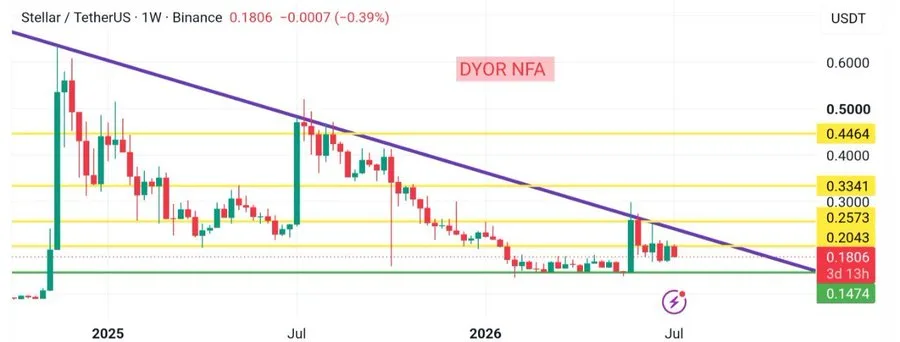
Resistance levels to be considered are $0.2043, $0.2573, $0.3341, and $0.4464. From the bottom side, support at $0.1474 is the level that needs to be protected to avoid further decline. RSI is increasing from an oversold zone, and MACD is flatlining, meaning that the negative momentum is slowing down.
Stellar’s Expanding Economy Draws Attention
Beyond price action, analysts are increasingly focusing on Stellar’s growing real-world asset ecosystem. According to Expert X Finance Bull, there are around $3.42 billion worth of tokenized assets on Stellar, which include government debt, business credit, stablecoins, real estate, and commodities in nine different categories.
The expert explained that this level of diversification is making Stellar evolve from being a payment platform to a more comprehensive financial system, thereby improving its case for XLM investments.
What Will Determine Stellar’s Next Major Move?
The next few months will probably be determined for Stellar by two factors: whether or not XLM will succeed in breaking its longstanding technical resistance levels and whether it will continue to attract different types of assets and users to its platform.
The breakout will be bullish for Stellar if there is more and more activity on-chain, while unsuccessful attempts at breaking resistance levels might confine the token within its range.
Also Read: Explosive RWA Boom: ONDO Rides $3.4 Billion Tokenized Stocks Surge
This article contains market analysis and price predictions. These are not guarantees. Crypto markets are volatile. Always DYOR. Not financial advice.



Be the first to comment