




TLDR
- ETH is trading at $1,794, up 3.09% in 24 hours with a $216.79B market cap
- Analyst Ted says ETH holding above $1,750 points to a move toward $1,850–$1,900
- Open interest rose 3.63% to $24.65B, showing growing confidence in futures markets
- Former Bank of America strategist Stephen Suttmeier sees a “tactical bottom” forming above $1,690
- Whale selling and a $52M ETF outflow remain key risks to the bullish setup
Ethereum is trading at $1,794 and showing signs of a potential move higher, though several headwinds remain. Here is what the data shows right now.
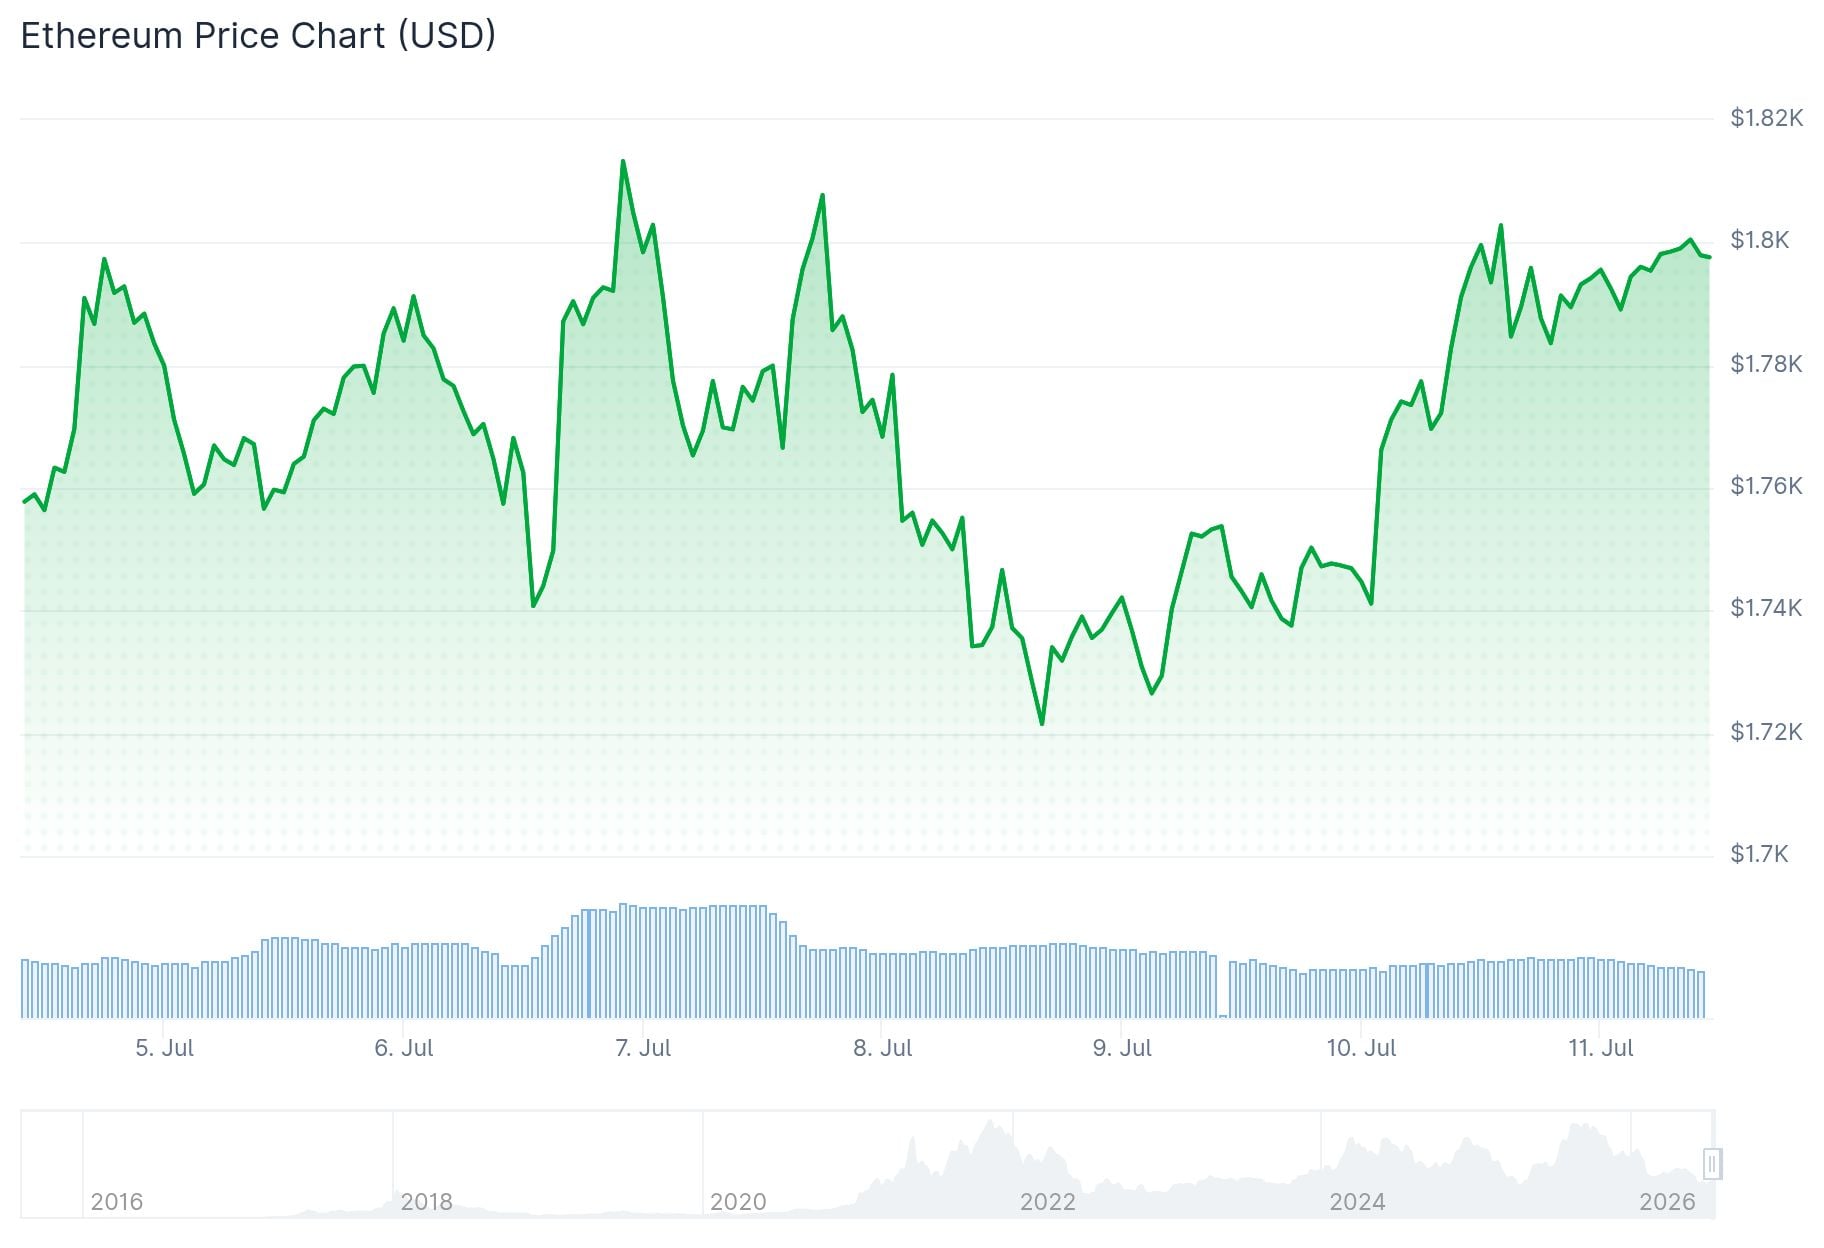
ETH gained 3.09% in the last 24 hours. Daily trading volume hit $17.08 billion, and its market cap sits at $216.79 billion, according to CoinMarketCap.
Crypto analyst Ted noted that ETH holding above $1,750 is technically healthy. In his view, sustained spot demand could push the price toward the $1,850–$1,900 range.
$ETH is holding above the $1,750 level, which is a good sign.
Spot demand is picking up a bit, which could push Ethereum towards the $1,850-$1,900 zone in the coming weeks. pic.twitter.com/A2eBbJbXVj
— Ted (@TedPillows) July 10, 2026
If ETH breaks above that resistance zone, it could attract more buyers and support the current recovery. However, a drop below $1,750 would weaken the bullish case.
Derivatives and On-Chain Data
Open interest in ETH futures rose 3.63% to $24.65 billion. Rising open interest alongside a rising price is generally viewed as a positive signal.
Derivatives volume did fall 6.21% to $28.76 billion. That suggests traders are holding positions rather than actively trading in the short term.

The OI-weighted funding rate sits at 0.0042%, above zero. This means more traders are positioned long, but without excessive leverage building up.
Analyst Ali Charts pointed out on X that ETH’s MVRV ratio has dropped below 0.8, putting it in what he calls “deep accumulation territory.” He noted this level was reached three previous times — December 2018, March 2020, and June 2022 — and each time marked a price bottom before a reversal.
ETHEREUM IS OVERSOLD!
On-chain data reveals the ETH MVRV ratio has officially dipped below 0.8, putting it into deep accumulation territory.
Historically, falling below this 0.8 MVRV level signals seller exhaustion, as aggregate market value falls significantly below total… https://t.co/LNkygeXO5n pic.twitter.com/jGhaQlV8fp
— Ali Charts (@alicharts) July 10, 2026
What Analysts Are Watching
Stephen Suttmeier, former Head of Technical Strategy at Bank of America, said ETH may be forming a “tactical bottom.” His view is that holding above $1,690–$1,700 supports that thesis.
He added that a decisive reclaim of $1,800 and the 50-day moving average would open the door to the 200-day MA at around $2,200. That would represent roughly 25% upside from current levels.
Fundstrat’s Tom Lee also shared Suttmeier’s analysis, lending further weight to the bullish technical setup.
However, exchange selling pressure has been rising since March. CryptoQuant reported a 6% surge in ETH hitting exchanges recently, slowing the move near $1,800.
Whale selling has not eased off either. Large holders were reducing exposure during the recent relief rally.
On the ETF side, five straight days of net inflows ended Thursday with a $52 million net outflow. That shift was tied to renewed Iran-U.S. tensions and bond market volatility.
ETH is currently trading just below the $1,800 level that analysts have identified as the key short-term trigger.


Be the first to comment