



Bitcoin trades near $64,500 on July 11 after breaking above the descending channel that has contained price since early June, with the falling 50-day moving average now standing directly overhead as the first test of whether the move has continuation in it.
Key Takeaways
- BTC has broken above its multi-week descending channel from the $57,800 low.
- 7-day exchange netflow remains deeply negative at -10,274 BTC despite a +127 BTC inflow on July 11.
- Funding cooled from 0.007781 to 0.004945 with open interest near $21.83 billion.
The channel break is the cleanest technical development Bitcoin has produced since the June selloff. Price spent five weeks grinding lower, printing the $57,800 low in late June before climbing back through the upper boundary this week. The structure that follows a channel exit tends to be decided quickly: either the breakout level holds as support on a retest, or price slips back inside and the move is classified as a fakeout.
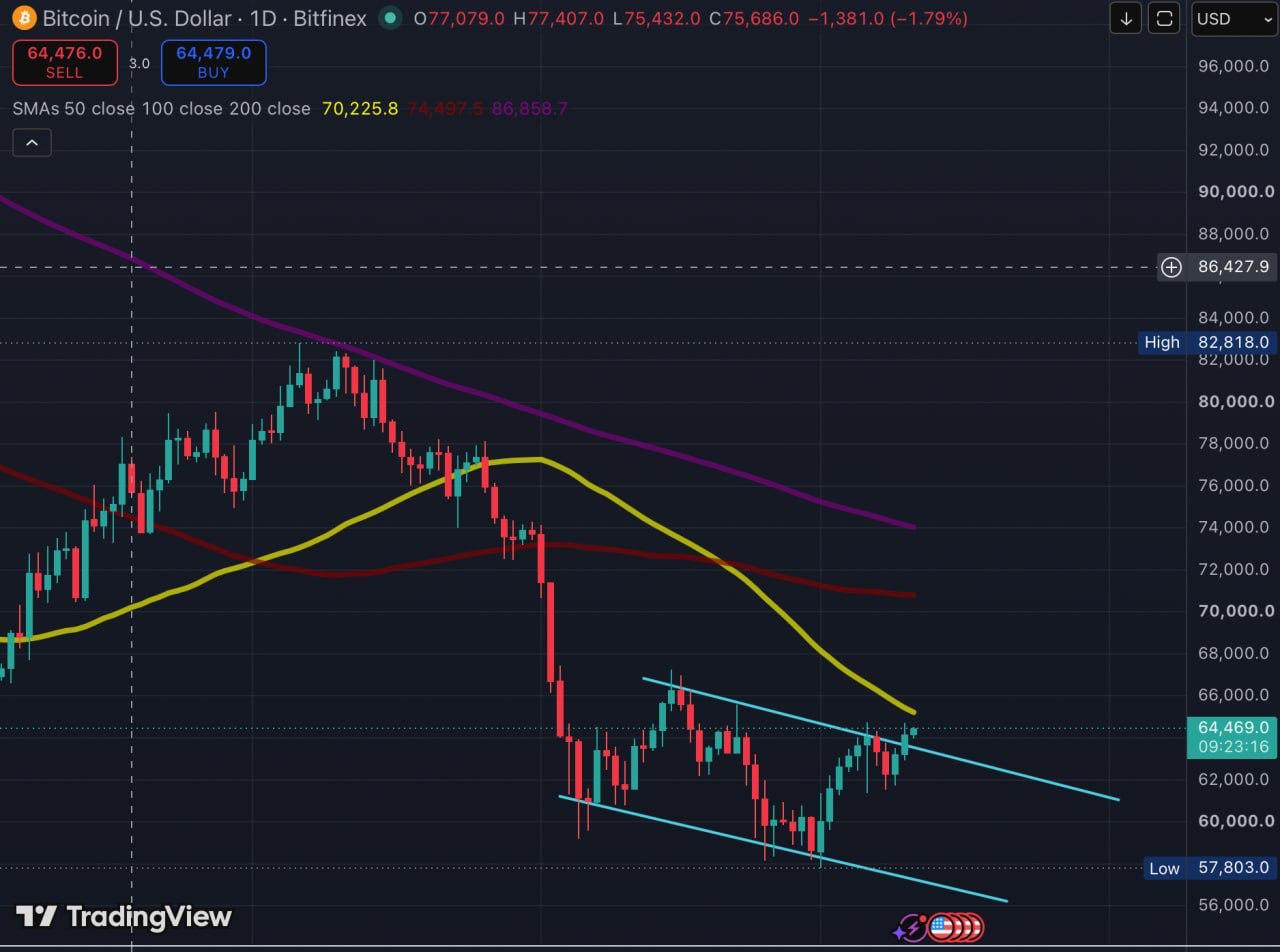
The 50-day SMA, currently hovering just above the price, is the level to watch. A daily close above this resistance, followed by a successful retest, could significantly increase the probability of a continued upward move. Rejection here keeps the sequence of lower highs intact.
On-Chain Data Reads as Cooling, Not Committing
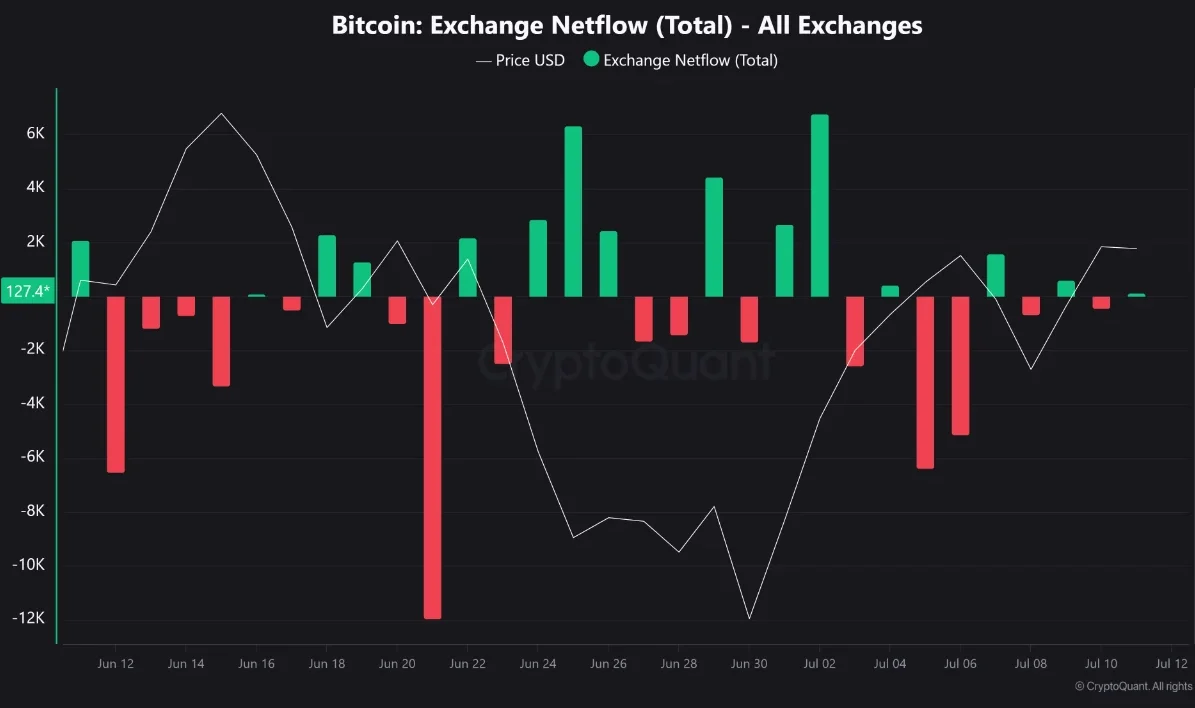
The flows behind the move look supportive without being decisive, per CryptoQuant data. Exchange netflow turned slightly positive at +127.45 BTC on July 11 after -432.25 BTC the previous day, a marginal shift that means little against the 7-day figure, which remains deeply negative at -10,274.19 BTC. Coins have been leaving exchanges all week; one small inflow does not establish renewed selling pressure.
Derivatives tell a similar story of tension draining rather than building. Funding fell from 0.007781 to 0.004945, still positive, so longs remain dominant, but the market is paying less for leverage than it was three days ago. Open interest near $21.83 billion is down just 0.13% on the day after rising 4.59% across three sessions, a pause rather than a flush. NUPL improved from 0.1601 to 0.1730, showing unrealized profits expanding without approaching the zones associated with overheated positioning.
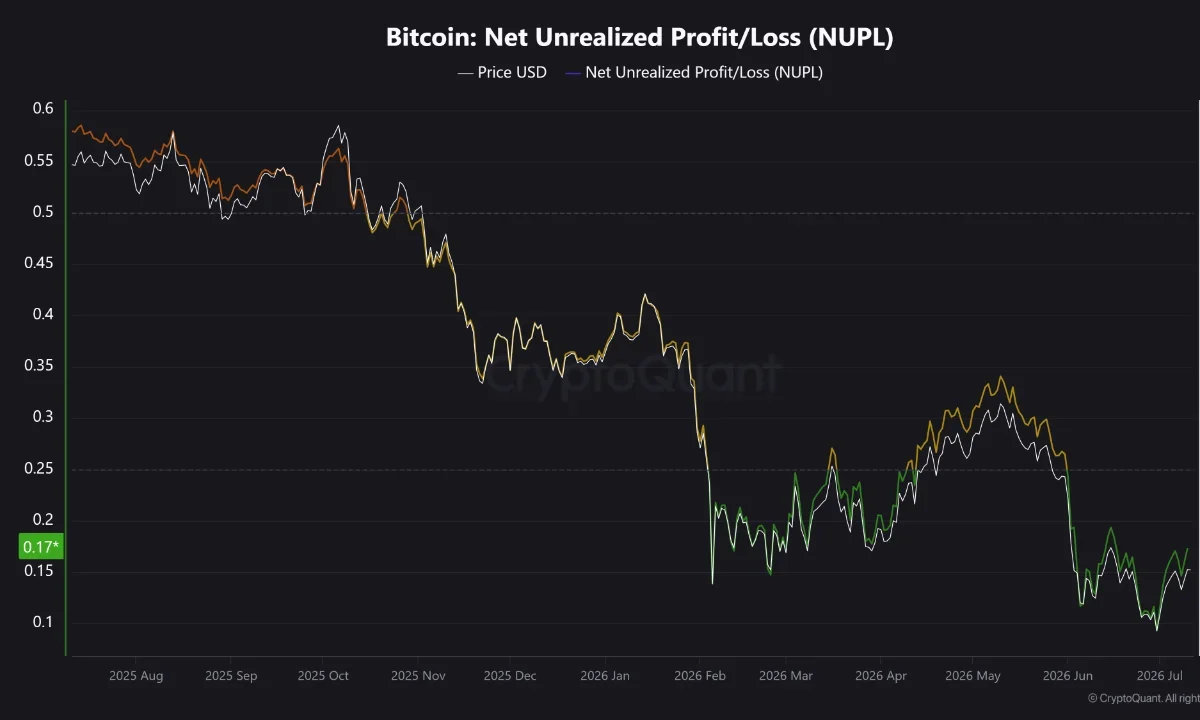
Taken together, the picture is neutral-to-constructive: spot flows supportive, leverage risk cooling, profitability improving, and none of it euphoric. The setup would weaken if exchange inflows become repeated and large, or if funding and open interest climb together while price stalls below the 50-day, the classic sign of leverage pushing against a wall that spot demand refuses to break. Until one of those happens, Bitcoin is stabilizing above its old channel rather than confirming a new trend, and the retest of the breakout line is the level that could decide which word applies.
The information provided in this article is for informational purposes only and does not constitute financial, investment, or legal advice. Cryptocurrency investments carry a high level of risk, and readers should conduct their own research and consult a professional advisor before making any investment decisions. Coindoo is not responsible for any losses incurred as a result of actions taken based on the content of this article.

Kosta has reported on cryptocurrency markets and blockchain infrastructure since 2020, bringing over six years of hands-on experience in the crypto industry built through daily tracking of markets, trends, and emerging blockchain developments. Specializing in Bitcoin on-chain analysis, institutional ETF flows, and digital asset price action, his work at Coindoo has been cited by other news agencies and consistently covers market developments with a focus on data-driven reporting across Bitcoin, Ethereum, Solana, and XRP.
Over the years, Kosta has contributed to multiple crypto media outlets in different regions, authoring over 6,000 articles across the sector. His reporting spans cryptocurrency markets and the broader fintech industry, tracking not only price action but also the technological and regulatory forces shaping the ecosystem.
To support his analysis, Kosta actively leverages on-chain data and metrics from leading platforms such as Santiment, Glassnode, and CryptoQuant, enabling deeper, evidence-based market insights. He believes in the power of transparency and the data that underpins the blockchain ecosystem.
His academic background in Marketing Management from Denmark further complements his analytical approach, adding a strong understanding of communication strategy and content positioning to his work.


Be the first to comment