



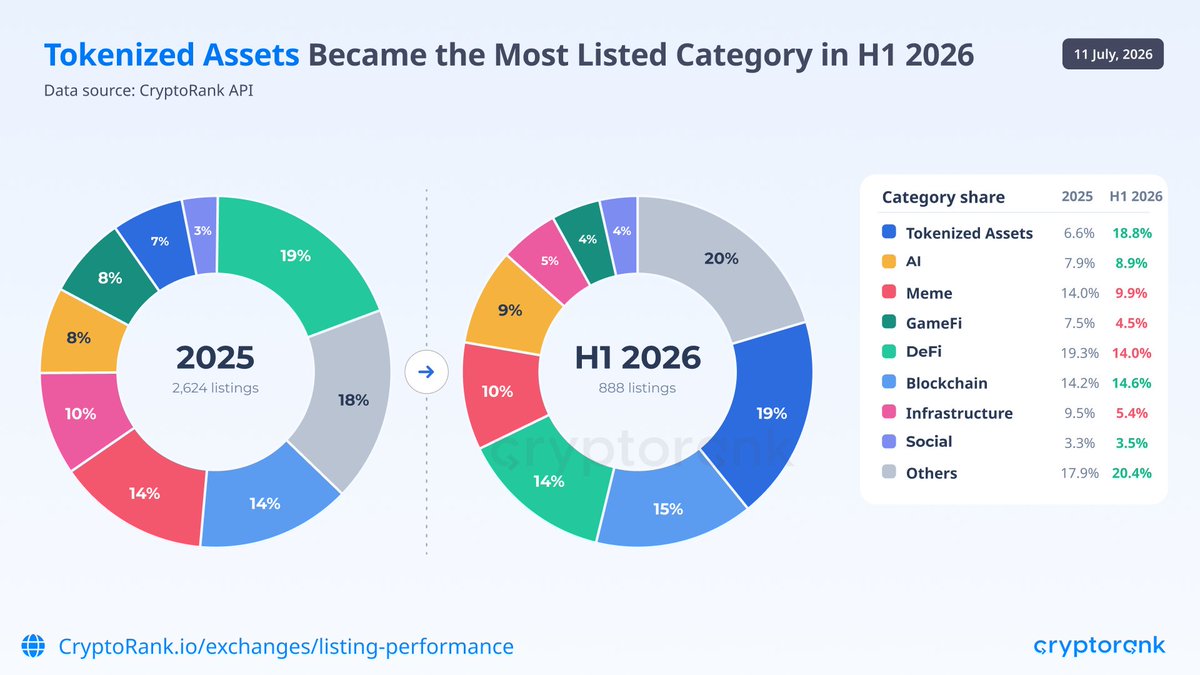
Tokenized assets became the most-listed token category on centralized exchanges in the first half of 2026, taking 18.8% of all new listings against 6.6% across the whole of 2025, according to CryptoRank data published July 11.
CryptoRank wrote on X that “nearly 1 in 5 tokens listed on CEXs in H1 2026 was a tokenized asset,” attributing the surge primarily to tokenized stocks from issuers including xStocks, bStocks, and Ondo. The listing shift is the retail-facing edge of a market whose on-chain value reached roughly $33.5 billion this month, and whose settlement layer is now being production-tested by the firm that clears nearly every US stock trade.
Key Takeaways
- Meme token listings fell from 14.0% to 9.9% of the total over the same period, with DeFi down from 19.3% to 14.0%
- On-chain RWA value tracked by rwa.xyz reached approximately $33.5 billion as of July 8, after roughly 30% growth in Q1 alone
- The DTCC began limited production trades of tokenized Russell 1000 stocks, ETFs, and Treasuries in July, with full launch targeted for October
The detail hiding inside the CryptoRank dataset is not just what exchanges listed, but how much less they listed overall. Centralized exchanges added 888 tokens in the first six months of 2026, a pace roughly one-third below the 2,624 listings of 2025. Listing slots became scarcer, and the reallocation within them is what makes the category shift meaningful: tokenized assets nearly tripled their share of a shrinking pool, while meme tokens dropped from 14.0% to 9.9% and DeFi from 19.3% to 14%.
A tokenized Apple share or Treasury fund is not a speculative bet on exchange volume the way a new meme listing is; it is an instrument with an external anchor price and an institutional issuer. Exchanges allocating a fifth of their scarcest resource to that category suggests they are positioning for a client base that wants traditional exposure on crypto rails, not more of the previous cycle’s inventory.
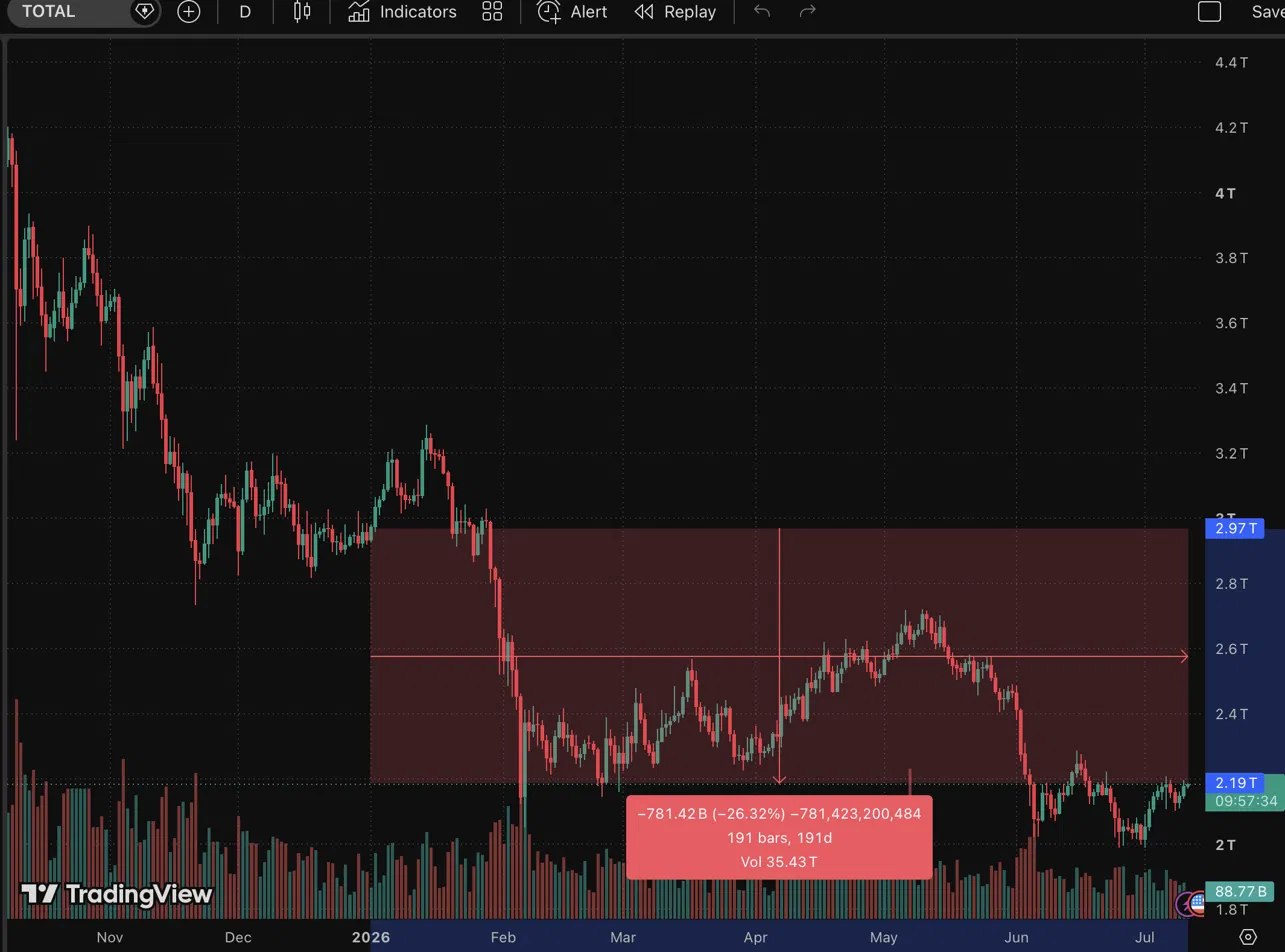
Part of the meme decline needs a less flattering explanation than rotation, though. The first half was simply weak: total crypto market capitalization fell roughly 26% over the 191 days from the start of 2026, dropping from about $2.97 trillion to $2.19 trillion by mid-July, per TradingView data.
Meme tokens are the market’s most cycle-dependent category, driven by hype and momentum that only a rising tape can sustain, so a shrinking listing share during a $780 billion drawdown partly reflects exchanges responding to dead demand rather than a permanent change in taste. Tokenized assets, by contrast, grew their share through the same drawdown, which is the stronger half of the signal: the category expanded in conditions that historically kill new listings altogether.
The On-Chain Numbers Underneath the Listings
The listing rotation tracks what the underlying market did. On-chain RWA value measured by rwa.xyz stood at approximately $33.7 billion as of July 10, excluding stablecoins, after growing roughly 30% in the first quarter alone. Tokenized US Treasuries remain the anchor category at approximately $15 billion, led by BlackRock’s BUIDL fund above $2.5 billion.
The fastest-moving segment is the one driving the listings. Tokenized equities represent about $2.19 billion in on-chain value, a small slice of the total that grew nearly 50% in the thirty days to early July. On Ethereum alone, tokenized assets on the base layer total around $25 billion, more than any other public network, a figure the account Ethereum Institutional highlighted on X this week alongside a roster of issuing banks that includes JPMorgan, BNP Paribas, UBS, and the European Investment Bank.
July Is the Month the Plumbing Went Live
The institutional development of the moment is happening at the settlement layer. The Depository Trust and Clearing Corporation, whose subsidiary custodies more than $114 trillion in securities, began limited production trades of tokenized assets this month, covering Russell 1000 equities, major index ETFs, and US Treasuries. More than 50 firms shaped the service through DTCC’s working group, spanning BlackRock, Goldman Sachs, JPMorgan, Citi, and Nasdaq on the traditional side and Circle, Ondo Finance, and Ripple Prime among crypto-native participants. A full commercial launch is targeted for October.
The production phase rests on an SEC no-action letter issued in December 2025, which gave participants a three-year runway to run tokenized securities without triggering existing custody and transfer-agent rules. The projections attached to this buildout come from names that previously supplied the skepticism. Geoff Kendrick, head of digital assets research at Standard Chartered, projects tokenized assets deployed in DeFi could reach $2.7 trillion by 2030, up from roughly 10% utilization today. BlackRock CEO Larry Fink, in his March annual letter, described a future in which every stock and bond could eventually trade in tokenized form.
Growth Figures Don’t Show Everything
The strongest caveat sits in the transfer data. Much of the on-chain RWA value reflects issuance rather than active trading, with large transfers clustering around $10 million each, a pattern consistent with institutional allocation batching rather than a functioning secondary market. Putting an asset on-chain does not create buyers for it, and most tokenized products still trade thinly behind whitelists and compliance gates.
The regulatory posture is also more conditional than the listing boom implies. The SEC warned in January that holders of synthetic tokenized securities, tokens that represent an underlying asset rather than constituting the security itself, carry third-party risks, including issuer bankruptcy, that holders of the actual securities do not. Most tokenized stocks currently listed on exchanges fall into exactly that synthetic category, which means the fastest-growing listing segment of H1 2026 is also the one operating with the thinnest investor protections.
This highlights a critical divide in the market. Synthetic tokens, the model behind most CEX-listed tokenized stocks, give the holder a claim against the issuer rather than direct ownership of the underlying security, exposing investors to counterparty and structural risk even where the tokens are fully collateralized.
The models now being production-tested by the DTCC take the opposite approach: the token operates inside the regulated custody chain, preserving the same legal ownership rights and investor protections as the conventional security. The industry’s shift toward native issuance is an attempt to close that gap, trading the easy accessibility of exchange-listed mirrors for tokens that are legally equivalent to the assets they represent.
Three measurable checkpoints will show whether the first-half rotation holds. CryptoRank’s Q3 data will reveal whether the tokenized-asset listing share sustains near 19%, and a market recovery would sharpen the test: if prices rise and meme listings rebound while RWAs hold their share, the shift is structural; if memes reclaim the shelf space the moment the tape turns green, H1 was partly a bear-market artifact.
The DTCC’s October commercial launch will test whether tokenized settlement works at production cost and latency for institutions built around T+1 cycles. And the on-chain equity figure bears the most watching: another quarter of 40-50% growth from $2.19 billion would confirm tokenized stocks as the sector’s second engine alongside Treasuries, while a stall would suggest the listing wave ran ahead of actual demand.
The information provided in this article is for informational purposes only and does not constitute financial, investment, or legal advice.

Kosta has reported on cryptocurrency markets and blockchain infrastructure since 2020, bringing over six years of hands-on experience in the crypto industry built through daily tracking of markets, trends, and emerging blockchain developments. Specializing in Bitcoin on-chain analysis, institutional ETF flows, and digital asset price action, his work at Coindoo has been cited by other news agencies and consistently covers market developments with a focus on data-driven reporting across Bitcoin, Ethereum, Solana, and XRP.
Over the years, Kosta has contributed to multiple crypto media outlets in different regions, authoring over 6,000 articles across the sector. His reporting spans cryptocurrency markets and the broader fintech industry, tracking not only price action but also the technological and regulatory forces shaping the ecosystem.
To support his analysis, Kosta actively leverages on-chain data and metrics from leading platforms such as Santiment, Glassnode, and CryptoQuant, enabling deeper, evidence-based market insights. He believes in the power of transparency and the data that underpins the blockchain ecosystem.
His academic background in Marketing Management from Denmark further complements his analytical approach, adding a strong understanding of communication strategy and content positioning to his work.



Be the first to comment