



What to know:
- PEPE price remains below a key descending trendline, keeping the broader bearish trend intact.
- A breakout above the trendline could trigger a rally toward the $0.00000460–$0.00000713 resistance zone.
- Failure to hold support may lead to another selloff, with $0.00000083 as the next downside target.

PEPE price remains under bearish pressure as it trades below a key descending trendline, though a short-term rebound is still possible. A breakout could signal recovery, while a further decline may extend losses. Meanwhile, improving momentum indicators suggest selling pressure is easing and volatility is stabilizing.
At the time of writing, PEPE is trading at $0.000002755 with a 24-hour trading volume of $130.23 million and a market capitalization of $1.14 billion. Following the 1.33% gain over the last 24 hours, the PEPE price structure points to a bullish reversal ahead.


Source: CoinMarketCap

Also Read: PEPE Price Analysis: Falling Wedge Breakout Sparks Hope for $0.00000550
PEPE Price Struggles: Is Another Selloff Coming?
However, the data from More Crypto Online highlighted that the PEPE price remains under bearish pressure as the meme coin continues trading below its key descending trendline, signaling that sellers still control the market.
Although a short-term Wave 4 corrective bounce remains possible, analysts say there is no confirmation that the broader downtrend has ended. A breakout above the trendline could trigger a recovery toward the $0.00000460–$0.00000713 resistance zone.


Source: More Crypto Online’s X Post
While the PEPE price stays under the yellow trendline, the bears will have an upper hand in the market, meaning that the cryptocurrency could head even lower.
If the support level is broken, the downtrend will continue its path towards the next support zone, which will be seen in January 2024 at the level of $0.00000083.
RSI and Bollinger Bands Point to Momentum Shift
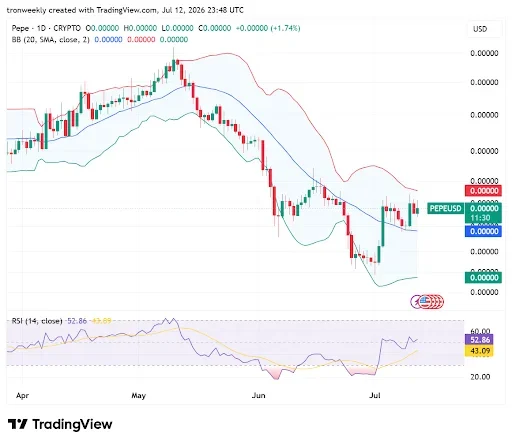
According to TradingView, the PEPE price has a market cycle from April to July. Starting with its peak in mid-May, the asset moved into a strong downward trend in June by making lower lows and went to a capitulation level at the start of July. A strong recovery ensued, and the price found itself consolidating around the middle MA line.

Source: TradingView
Technical signals affirm that such a trend change has occurred. The Bollinger Bands have widened during the fall in June, yet now they are narrowing as volatility reduces towards the baseline.
On the other hand, the RSI has recovered from oversold conditions at 52.86, remaining above the 43.09 signal line.
Following the upward price predictions and improving technicals, the PEPE price is also moving in an upward direction. However, the general trend in the crypto market is cautious, and the deeper retracements by the BTC price could make the PEPE breakout a fakeout.
What Happens Next?
The future path of the PEPE price is determined by whether bulls succeed in breaking out of the falling trend line, signaling a trend reversal.
In that case, the rally could push PEPE towards the $0.00000460-$0.00000713 resistance area. On the other hand, failure to hold the support level could lead to more selling pressure.
Also Read: PEPE Price Prediction: Falling Wedge Signals Breakout to $0.00001050
This article contains market analysis and price predictions. These are not guarantees. Crypto markets are volatile. Always DYOR. Not financial advice.



Be the first to comment