




TLDR
- U.S. June CPI came in at 3.5%, below analyst expectations, boosting crypto markets
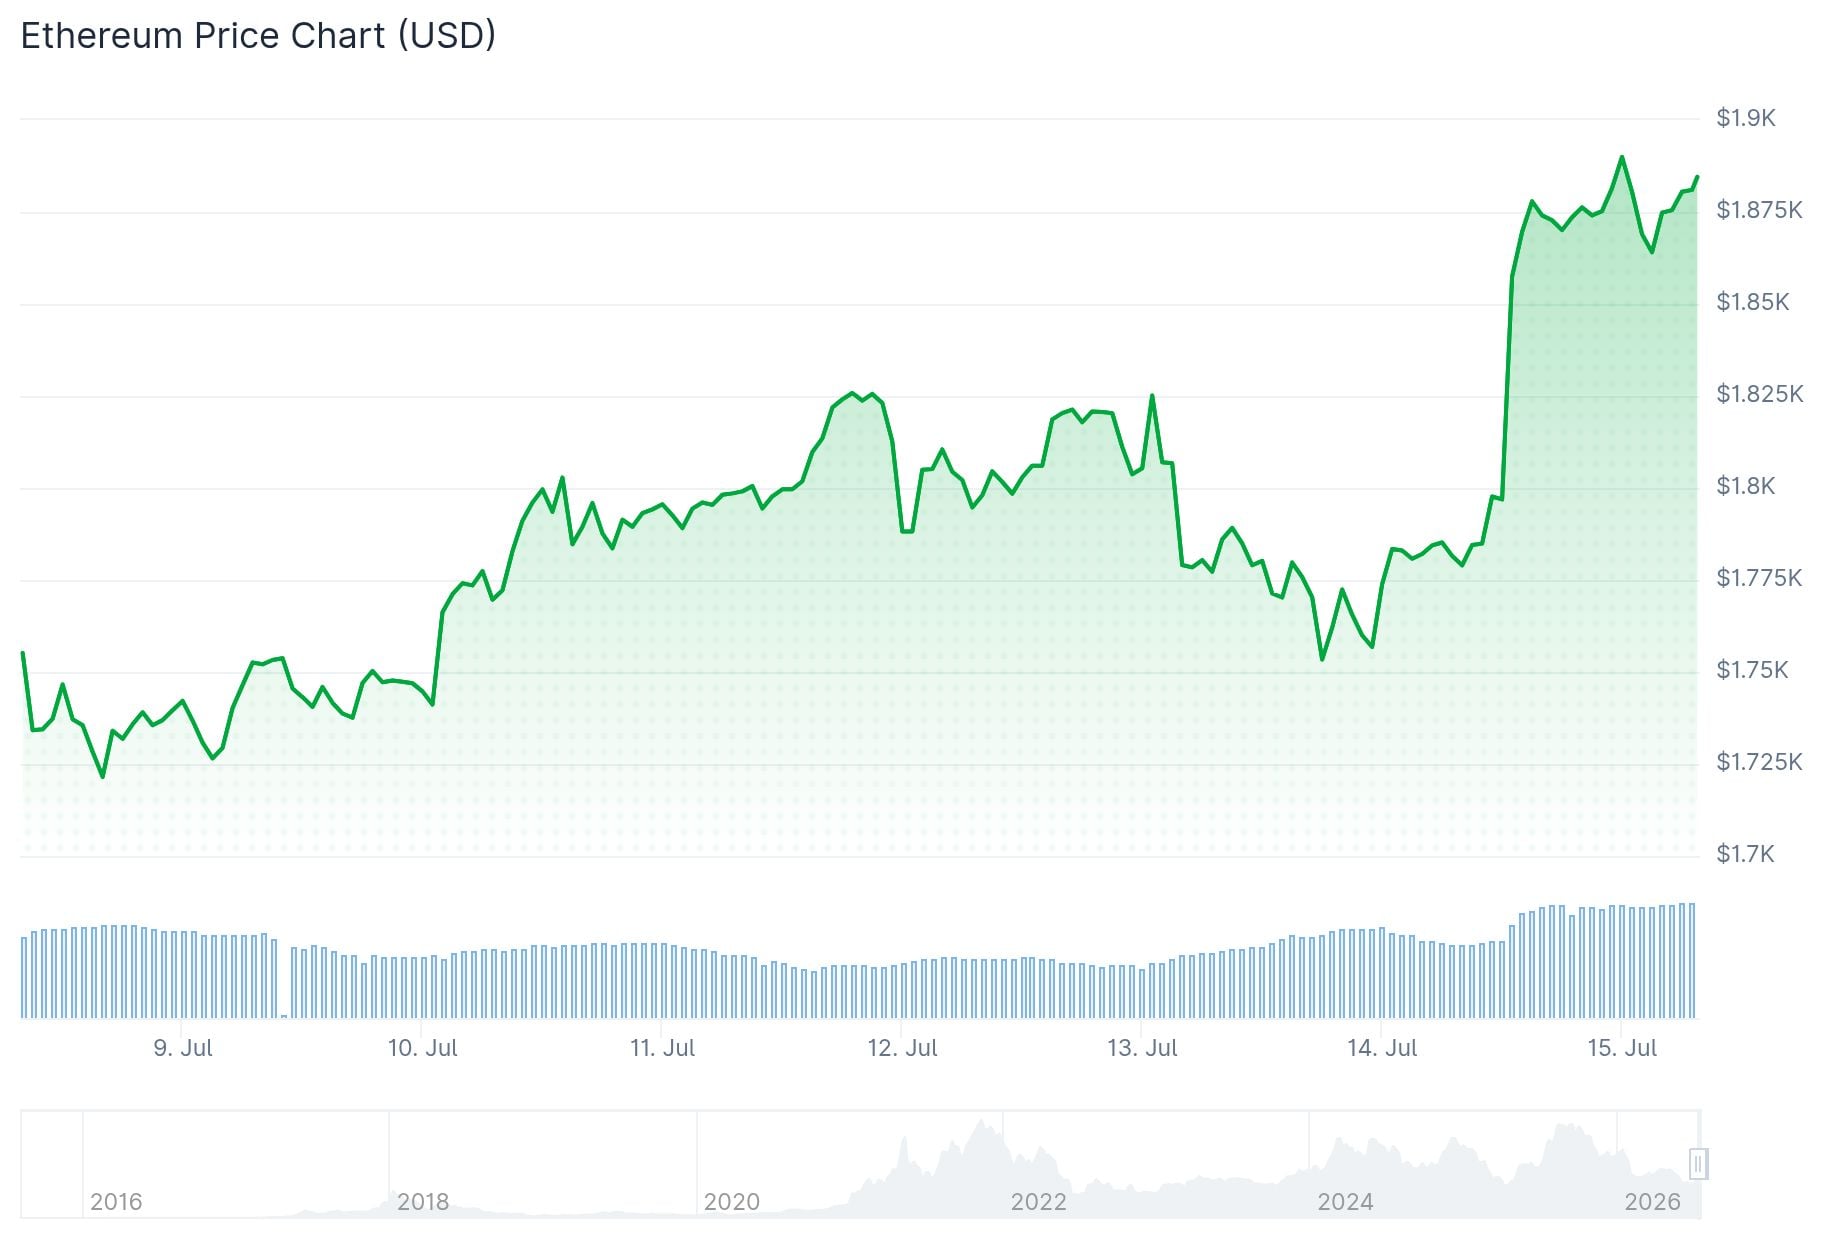
- ETH jumped over 5% in 24 hours, breaking above the key $1,800 resistance level
- Nearly $300 million in short positions were liquidated, with ETH accounting for over a third
- Analyst Ali Charts notes the SuperTrend indicator has turned bullish on ETH on the 3-day chart
- The 200-day EMA around $2,200 is the next major resistance level, with $2,400 as the broader target
Ethereum has jumped more than 5% in 24 hours after U.S. inflation data for June came in cooler than expected.
The Consumer Price Index (CPI) rose 3.5% year-over-year in June. That was 30 basis points below what analysts had predicted. Month-over-month, prices actually fell 0.4%, compared to the 0.1% drop economists expected.
Core inflation, which strips out energy costs, also dropped by 20 basis points. That matters because it gives the Federal Reserve less reason to raise interest rates.
Data from CME FedWatch shows that the odds of no rate cut in September jumped from 25% to 39% in a single day. While 61% of analysts still expect a rate hike, the shift shows the macro backdrop is changing.
Risky assets like crypto tend to do well when rate hike expectations fall. ETH was one of the biggest beneficiaries on Monday.
Short Squeeze Hits ETH Hard
ETH broke above $1,800 — a key resistance level — triggering a wave of short liquidations. Data from CoinGlass shows nearly $300 million in short positions were wiped out in 24 hours.
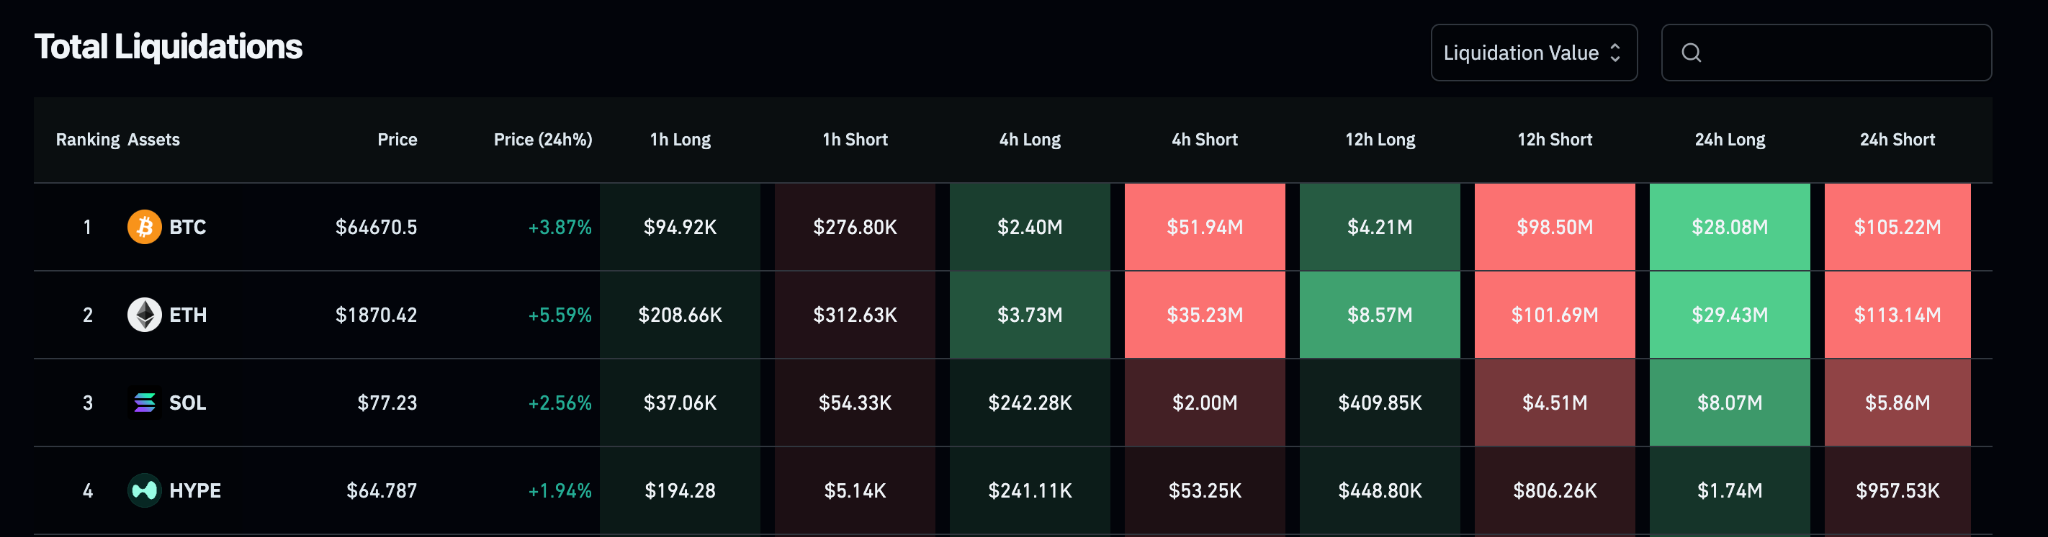
ETH was responsible for more than a third of those liquidations, temporarily outpacing Bitcoin. That tells you how many traders had been betting against ETH at that price level.

Analyst Ted Pillows pointed out that ETH had been holding above the $1,750 support zone before the breakout. He noted that buyers were clearly stepping in at that level, and that as long as support held, the next big move would likely be to the upside. That support held, and the move followed.
$ETH held above its $1,750 support zone.
This is a good sign that shows that buyers are stepping in at the support.
As long as the support level holds, I think the next big move in Ethereum will be to the upside. pic.twitter.com/MuEhunsmRJ
— Ted (@TedPillows) July 14, 2026
Trading volume for ETH was also up 33% in the same period. High volume alongside a price breakout is generally seen as a stronger signal than price movement alone.
ETH had previously formed a double bottom at $1,550. That level held twice, and the bounce from it was strong. The $1,800 level was the neckline of that pattern — and ETH just cleared it.
Bullish Technical Signals Stack Up
The daily RSI also showed a bullish divergence before this move. Price was falling, but selling pressure was easing. That pattern often appears before a reversal.
Crypto analyst Ali Charts flagged another technical signal around the same time. He noted that the SuperTrend indicator had just turned bullish on Ethereum’s 3-day chart. He pointed out that the last two times this signal appeared, ETH went on to rally 72% and 177% respectively.
The SuperTrend indicator has just turned bullish on Ethereum.
The last two buy signals on the 3-day chart were followed by bull rallies of 72% and 177%.
What do you think happens next for $ETH? pic.twitter.com/uoPoobV0Sd
— Ali Charts (@alicharts) July 14, 2026
The 200-day exponential moving average (EMA) currently sits around $2,200. That is the next level bulls will be watching closely.
If ETH clears $2,200, the next target is $2,400. That level also lines up with a long-term buy signal on the weekly chart, which appeared after the RSI dropped below 30.
ETH was trading around $1,850 at the time of writing, up over 5% on the day.



Be the first to comment