



In brief
- Bitcoin broke above $64K resistance Tuesday and is trading flat at $64,858 today—just 0.18% down, barely breathing.
- A death cross on the charts keeps the macro trend bearish, with BTC sitting roughly 5% above the channel that would drag it back into a confirmed downtrend.
- On Myriad, traders are pricing in 66.6% odds that Bitcoin dumps to $55K before it sees $84K again.
Wall Street had a solid Tuesday, but Bitcoin and the rest of the crypto market finds itself on less steady ground.
The S&P 500 gained 0.39% and the Nasdaq climbed 0.67% on Tuesday, boosted by a June PPI report that came in below expectations—producer prices actually fell 0.3% on the month, mostly driven by a collapse in gasoline prices. That data has been pushing down the odds of a July Federal Reserve rate hike, going from 31% last week down to just 12.3% today, per CME FedWatch. When interest rates go down—or, in this case, remain steady—that generally bodes well for risk assets, such as tech stocks and cryptocurrencies.
The VIX, Wall Street’s “fear gauge,” fell to 16.5 points, which means traders are overall confident and calm, not expecting big swings in the near future. Goldman Sachs, Morgan Stanley, JPMorgan, and Citi all posted Q2 earnings that beat analyst estimates. The macro vibe is calm, risk-on, and quietly optimistic.

Which makes it a strange time to be looking at the Bitcoin price chart.
Bitcoin price: A breakout without conviction
Bitcoin cleared the $64K resistance mark on Tuesday, tagging a daily high of $65,511 before settling at $64,858—flat on the day, down just 0.18% on the forming candlestick. For a coin that spent the better part of two weeks getting turned away at this level, punching through is meaningful.
Now, whether it sticks is the actual question.
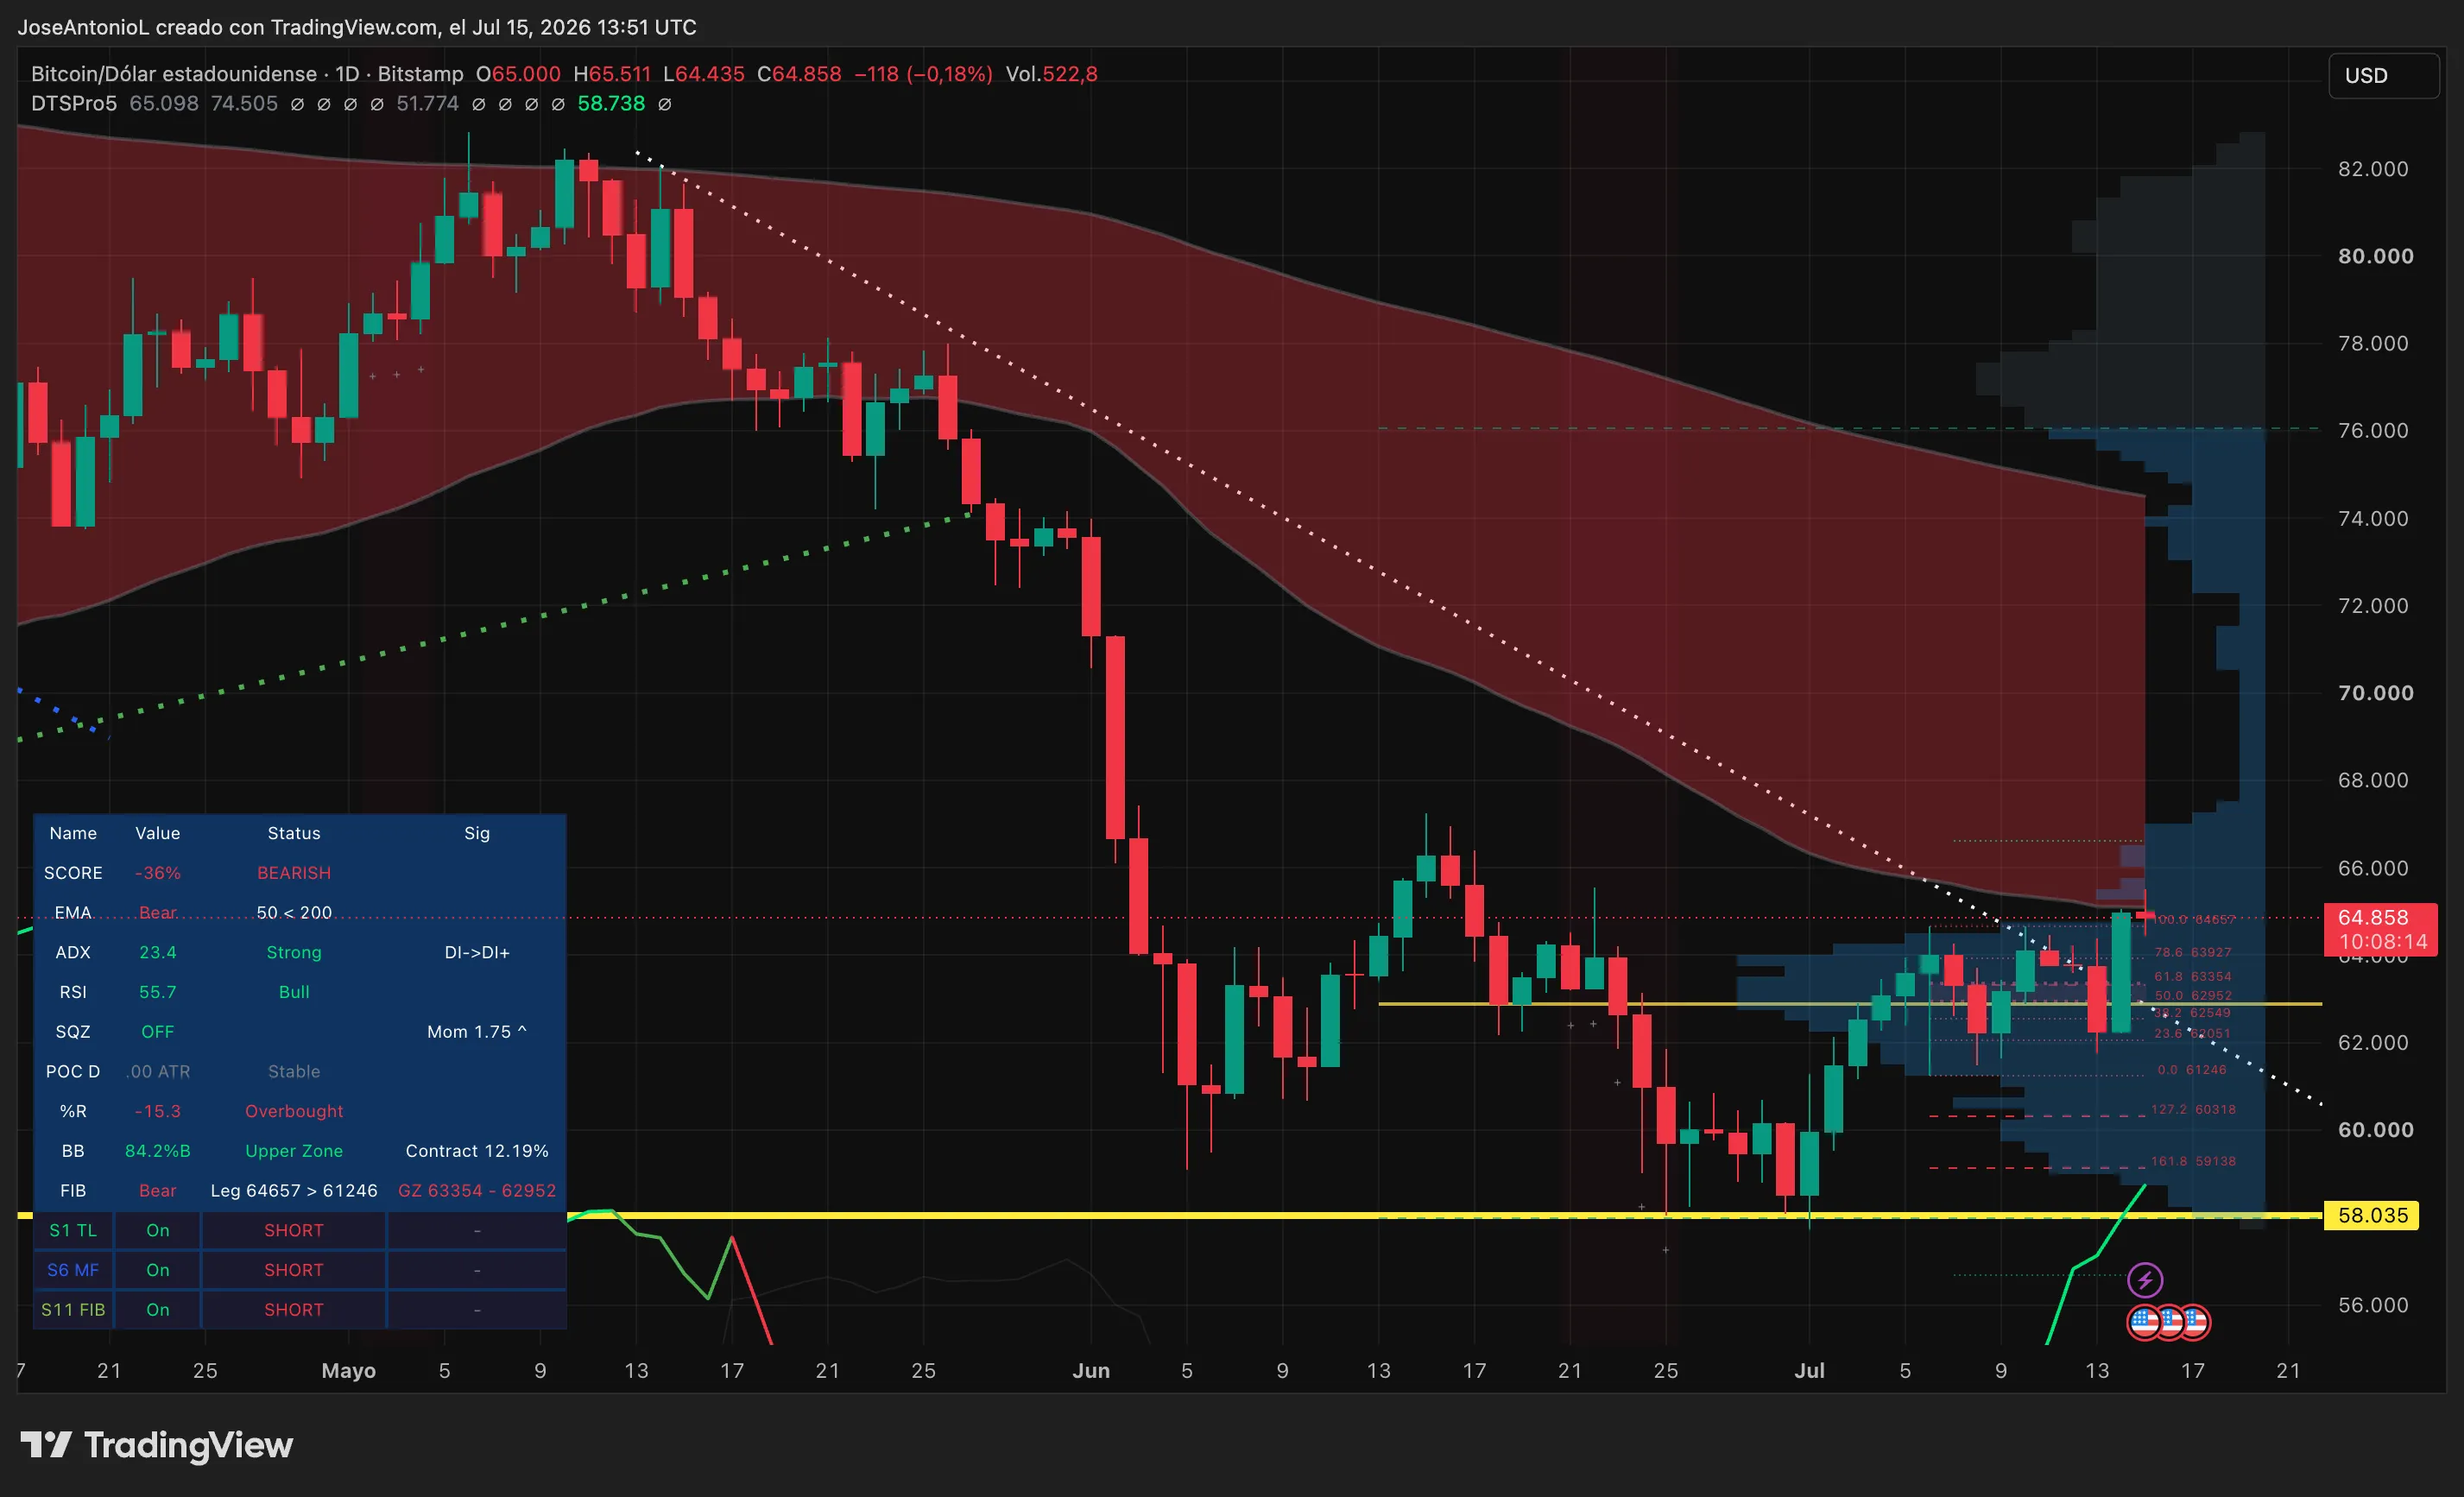
The chart still shows a descending trend channel intact since Bitcoin’s May highs near $82,000, defined by a clearly visible declining trendline pressing from above. The breakout puts BTC outside that channel—but only barely. A 5% slip from here and the structure is back in play, with bears back in the driver’s seat.
The broader picture remains bearish. Our own aggregate indicator score sits at -36%, headlined by a formation that traders refer to as a death cross: the average price of the last 50 days is trading below the average price of the last 200 days. This is the most recognizable signal of a bearish long-term trend, and there is still no sign of the gap between both averages starting to close.
The ADX, or Average Directional Index, sits at 23.4, showing that the bearish trend is losing strength and is weakening. But it’s still in play. ADX measures trend strength, regardless of direction, on scale from 0 to 100. Traders typically use 25 as the dividing line: above it, a real trend is in place; below it, the market is choppy.
But traders can breathe a little: The signal is transitioning from Di- (bearish dominance) to Di+ (bullish dominance). That’s a regime shift in progress, not a confirmed one.
The Relative Strength Index, or RSI, is at 55.7—neutral to slightly bullish, with room to climb before overbought territory kicks in above 70. The Squeeze Momentum Indicator (which signals a compression before an explosive movement) is off, but momentum is rising at 1.75 and pointing up. When this releases, the move tends to be sharp. The problem is, it doesn’t come with a direction label, and this is why other indicators come into play.
Why the bullish case could work
The macro backdrop is genuinely supportive right now. Easing inflation, strong corporate earnings, and a Fed that’s unlikely to hike in July all create conditions where risk assets can breathe.
Other than that, the son of the President of the United States is openly shilling Ethereum, the world’s second-largest cryptocurrency by market capitalization. This is not conclusive at all, but still is another sign that crypto continues to attract interest from wealthy and politically connected investors.
https://twitter.com/EricTrump/status/2076065170099417470
The ADX transition from Di- to Di+ suggests the directional flow is tilting toward buyers. RSI still has room before it’s overbought. If BTC holds $64K for a few sessions and confirms the breakout, the next targets open up around $66,500–$67,600, with $70K plausible if momentum builds.
Why the bears (and Myriad) have a point
The Fibonacci analysis of natural support and resistance zones in a trend, places BTC right at the 100% level of a bearish leg that ran from $64,657 down to $61,246—exactly where sellers tend to re-emerge after a recovery move. The golden zone with most activity (the 50%–61.8% retracement band at $62,952–$63,354) already got cleared on the way up, but that also means it becomes the first area of interest if bulls lose grip.
And on Myriad, a prediction market developed by Decrypt’s parent company Dastan, the crowd isn’t buying the breakout story.
Prediction market traders have placed odds at 66.6% that Bitcoin dumps to $55K, against just 33.4% on a pump to $84K. And the odds have not moved with the price swing. That’s a 2-to-1 lean toward more pain—and Myriad traders have recently had a better read on Bitcoin’s recent direction than the chart optimists.
Daily Debrief Newsletter
Start every day with the top news stories right now, plus original features, a podcast, videos and more.



Be the first to comment