


Bitcoin traded between $64,000 and $64,600 on July 16, 2026, after being rejected from resistance near $65,700 to $65,750 the previous session, with technical analysts split on whether this represents a bullish recovery or a bearish breakdown from a longer consolidation.
What Happened To Bitcoin This Week
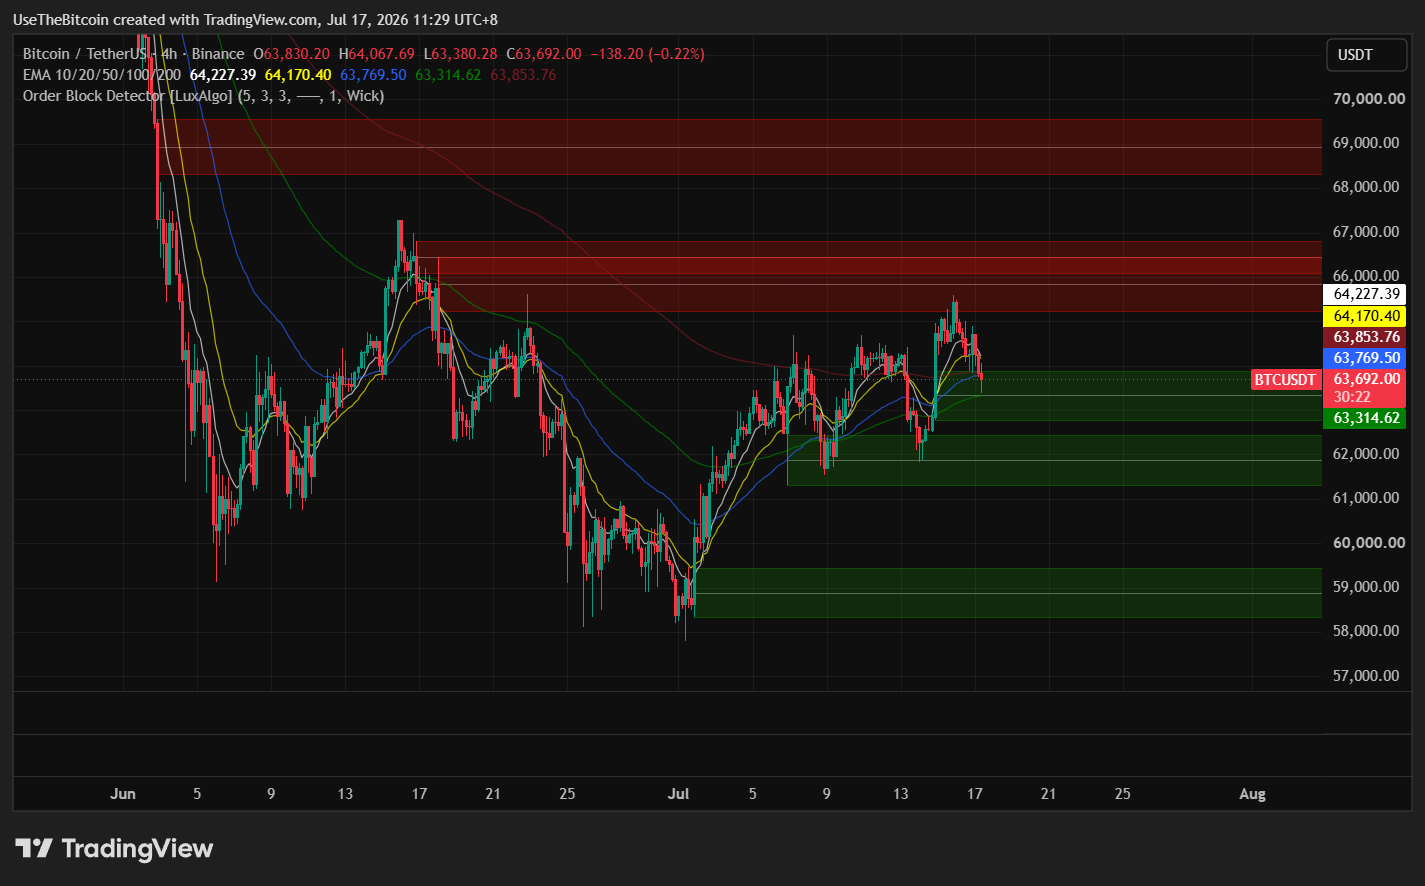
A sharp washout on July 13 took Bitcoin from around $64,570 to roughly $61,900, but heavy selling near that low failed to push the price meaningfully lower, and the market recovered to $64,000-$64,300 by July 14.
On July 15, Bitcoin reached approximately $65,740 but could not hold that level, pulling back as the advance attracted less buying support than the prior session’s recovery.
Rising US-Iran tensions have been a key driver capping the recovery. Continued military escalation in the Middle East has pushed crude oil prices higher, reviving inflation concerns that offset the initial support BTC received from softer-than-expected US CPI and PPI data earlier in the week.

Institutional flows showed mild improvement into the middle of the week, with spot Bitcoin ETFs recording $181.08 million in inflows on Tuesday and $107.80 million on Wednesday, though these gains only partially offset a sharp $424.66 million outflow on Monday, according to SoSoValue data.
| Level | Role | Notes |
| $60,000 | Psychological support | The level many traders don’t want to revisit |
| $61,800–$62,000 | Near-term support | First support zone below the current price |
| $63,750 | Bearish breakdown level | Acceptance below this invalidates the current recovery |
| $64,000–$64,300 | Structural support | Recovered on July 14, holding this keeps the pullback normal |
| $65,118 (50-day EMA) | Immediate resistance | Rejected here on July 15, Wednesday |
| $65,300–$65,750 | Bullish confirmation zone | Buyers need to hold above this to strengthen the recovery case |
| $67,700–$72,000 | Broader supply zone | Prior swing high and liquidity pool |
| $68,444 / $74,515 | 100-day / 200-day EMA | Both still sloping down, reinforcing the longer-term bearish structure |
Historical Context On Bitcoin’s Price
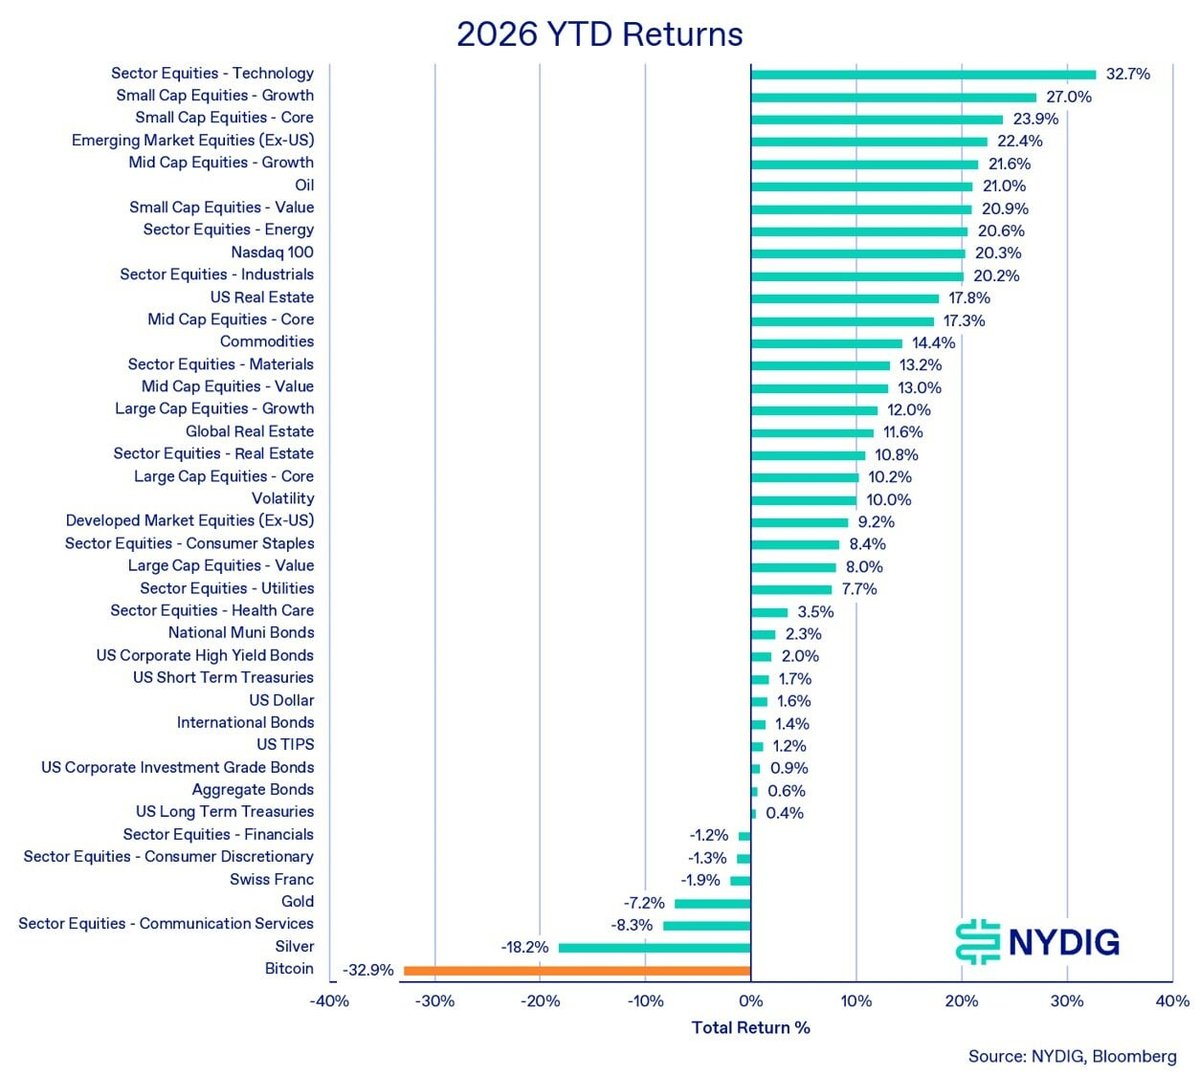
Bitcoin remains down nearly 50% from its October 2025 all-time high near $126,000, and NYDIG’s Q2 2026 report frames the current correction as comparable in depth and duration to Bitcoin’s prior four-year bear markets in 2014, 2018, and 2022.
NYDIG’s analysis attributes the weakness to crypto-specific factors rather than a broader risk-off environment, noting that Bitcoin fell 32.9% in the first half of 2026 while the Nasdaq 100 rose 27.7% over the same period. The firm’s historical comparison points to a possible $38,000 to $39,000 bottom later this year if the pattern holds.
Strategy, formerly MicroStrategy, introduced a Digital Credit Capital Framework during this period, authorizing up to $1.25 billion in Bitcoin monetization to build dollar reserves, pay preferred dividends, cover interest expenses, and fund share repurchases.
NYDIG says this shifts the market’s view of Strategy from a one-way accumulator to a company now willing to sell BTC under specific conditions, a meaningful change given the company’s outsized role in institutional Bitcoin demand. Readers can find more on Strategy’s evolving approach in our coverage of Strategy’s selective Bitcoin selling tactics.
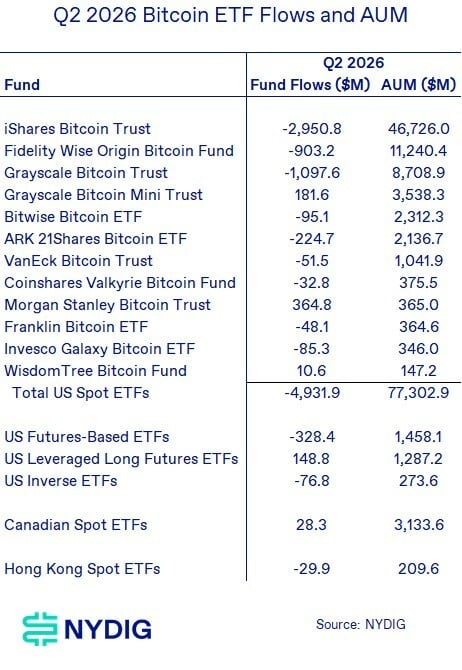
Separately, ETF flows painted a mixed picture for institutions in Q2. Overall net outflows totaled roughly $4.9 billion, led by BlackRock, Grayscale, and Fidelity funds, while Morgan Stanley’s newer Bitcoin ETF bucked the trend with $364.8 million in inflows.
For background on evaluating Bitcoin ETFs in general, our guide, 5 Things Bitcoin ETF Investors Should Know, covers the basics.
BTC Technical Analysis Outlook
The technical picture is mixed. On the bullish side, Bitcoin’s recovery has not yet earned a confirmed breakout, with $65,300 to $65,400 needed to strengthen the case and $65,700 to $65,750 as the next serious test.
BTC has also defended the $61,000 to $62,000 zone multiple times on the 4-hour chart, and rising spot order sizes suggest larger participants have been accumulating, even as the daily chart keeps BTC below both its 100-day and 200-day moving averages, leaving the broader trend technically bearish.
On the bearish side, there seems to be an attempt to close below the triangle on the daily timeframe this week, pointing to $61,800 to $62,000 as the first support to watch and $60,000 as the level many traders hope not to revisit. We will have to see if the price successfully retests the trendline as support before confirming a move higher.
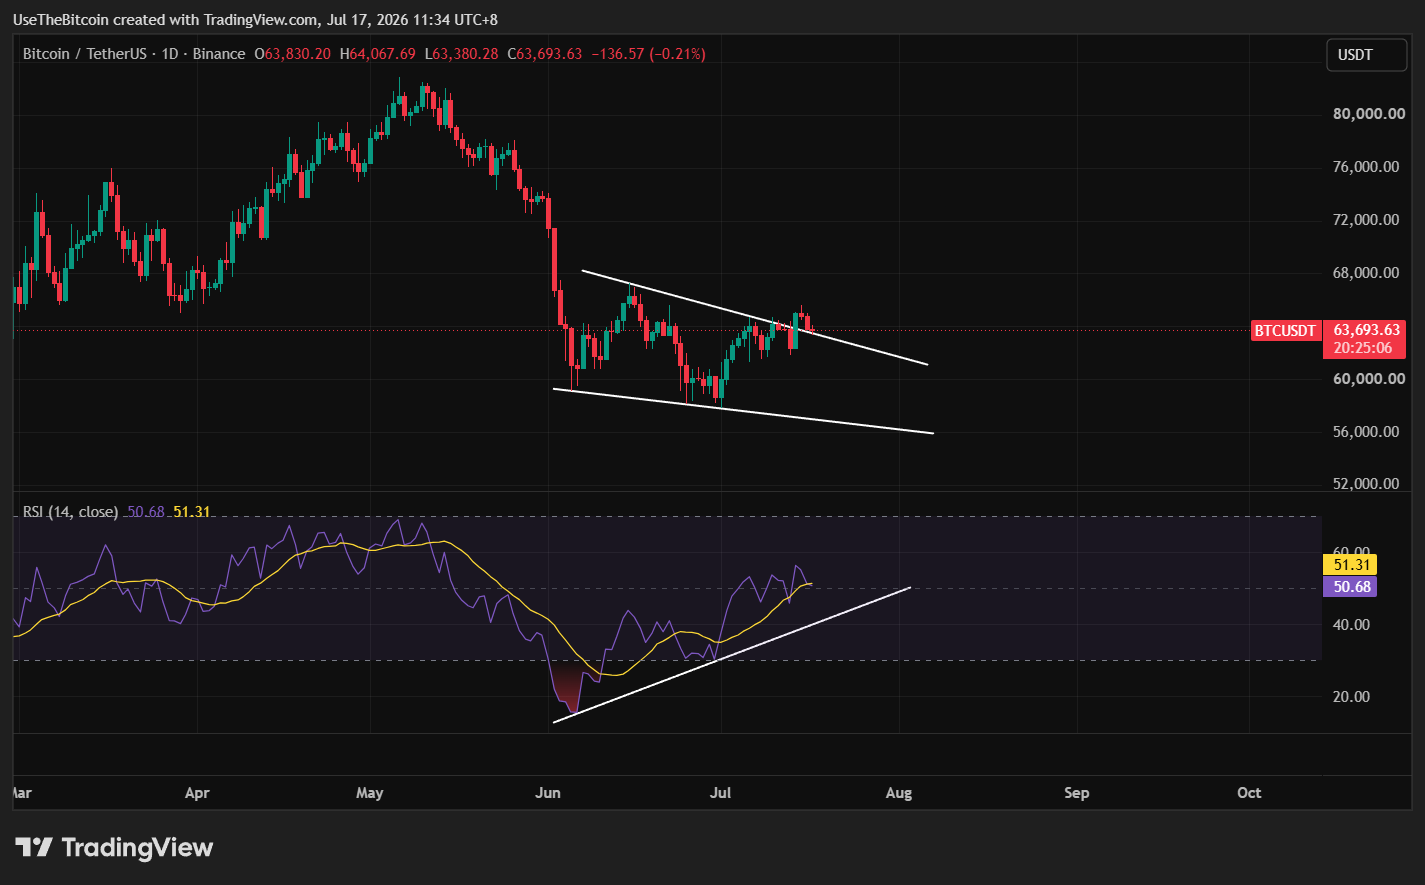
However, if buyers do reclaim and defend $65,500, the previous day’s rejection could have been a bear trap, reopening the path toward $67,500 to $70,000.
Catalysts to Watch for Bitcoin
NYDIG’s report flags several catalysts that could determine Bitcoin’s next move. The Senate’s July-to-August window is described as the last realistic opportunity to pass the CLARITY Act before political hurdles increase, with ethics concerns and stablecoin yield provisions still unresolved. Our coverage of the CLARITY Act as a shield for Bitcoin and Ethereum tracks that bill’s progress in more detail.
Moreover, elevated interest rates under Federal Reserve Chair Kevin Warsh continue to pressure liquidity-sensitive assets, and continued Iran-related oil price pressure could delay any rate cuts further.
NYDIG also flagged two executive orders on quantum technology signed by President Trump as a longer-term consideration for Bitcoin’s cryptography and pointed to the KelpDAO bridge exploit as a reminder that infrastructure and security risk across DeFi remain an ongoing concern separate from price action itself.
Disclosure: The writer holds Bitcoin.
Frequently Asked Questions
Need a refresher? Here are the questions traders are asking about Bitcoin this week.
What price level would confirm a Bitcoin breakout right now?
Bitcoin needs to hold above $65,300 to $65,400 to strengthen the bullish case, with $65,700 to $65,750 as the next serious resistance test. A brief spike through either level isn’t the same as a confirmed breakout, since the market needs to spend time above the level or successfully retest it as support before the recovery counts as validated.
What would invalidate Bitcoin’s current recovery?
A sustained move below $64,300 would weaken the recovery, and acceptance below $63,750 would invalidate it more decisively, exposing deeper support around $61,800-$62,000 and potentially $60,000. The distinction between a brief dip and genuine acceptance below these levels matters more than any single candle.
Could Bitcoin fall to $38,000 in 2026?
NYDIG’s Q2 2026 report raises that possibility by comparing the current correction to Bitcoin’s prior four-year bear markets in 2014, 2018, and 2022, which shared similar depth and duration. It’s a historical comparison rather than a guaranteed outcome, and it depends on whether current crypto-specific weaknesses, including soft-spot demand and rising leverage, continue to build.
Why does Strategy’s new Bitcoin monetization framework matter?
Strategy’s Digital Credit Capital Framework authorizes up to $1.25 billion in Bitcoin monetization for purposes including dollar reserves, preferred dividends, and share repurchases. This matters because Strategy has been one of Bitcoin’s largest and most consistent buyers, and a framework that allows selling under specific conditions changes the market’s view of the company from a one-way accumulator to a more conditional one.
What is the single biggest catalyst to watch for Bitcoin right now?
The CLARITY Act’s Senate vote in the July-to-August window stands out, since its passage would permanently settle a regulatory question that has hung over crypto markets, while a delay or failure could extend uncertainty further. Fed policy under Chair Kevin Warsh and ongoing Iran-related oil pressure are also worth watching, since both affect the liquidity conditions that leveraged assets like Bitcoin depend on.



Be the first to comment