



What to know:
- BCH price confirmed a bearish triangle breakdown below the $220 support level.
- RSI and MACD indicate weakening bullish momentum and growing selling pressure.
- Reclaiming the $220-$223 resistance zone could revive bullish sentiment.
Bitcoin Cash (BCH) price remains under short-term bearish pressure after confirming a breakdown from a symmetrical triangle pattern. Momentum indicators continue favoring sellers, reflecting weakening buying strength. However, the broader price structure still supports the possibility of a bullish reversal if key resistance levels are successfully reclaimed.
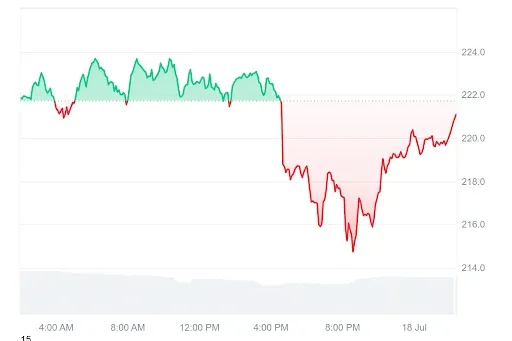
At the time of writing, BCH is trading at $220.79, with a 24-hour trading volume of $161.12 million and a market capitalization of $4.39 billion. Despite the signs of stability over the past 24 hours, BCH continues to show a resilient price structure, keeping the possibility of a bullish reversal intact.

Source: CoinMarketCap

Also Read: Bitcoin Cash Set to Surge: BCH Price Could Hit $650 Soon
BCH Price Breakdown Signals Near-Term Weakness
Furthermore, the crypto analyst Crypto With Gopal highlighted that the BCH price on the 15-minute chart confirms a bearish continuation after breaking below a symmetrical triangle.
The BCH price failed to hold the ascending support trendline, while repeated rejection from descending resistance highlighted weakening buying interest. The confirmed breakdown shifted short-term momentum decisively in favor of sellers across the market.
The breakdown dragged the BCH price below the crucial $220 support level, validating the triangle’s bearish continuation pattern.
Based on the formation’s measured move, the immediate downside target stands near $213-$214. A sustained decline below that region could extend losses toward the $210 psychological support area.


Source: Crypto With Gopal’s X Post
If buyers take back the triangle and manage a close above $223–$224, the grip on the BCH price by bears will be greatly reduced.
An uptrend will pave the way for an up-move towards $226 before encountering resistance at $229–$230. Before that, the $213-$214 downside target remains the main technical objective, according to crypto analyst Crypto With Gopal.
RSI and MACD Reflect Weakening Buying Strength
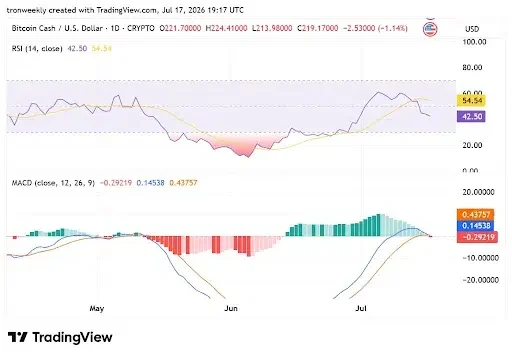
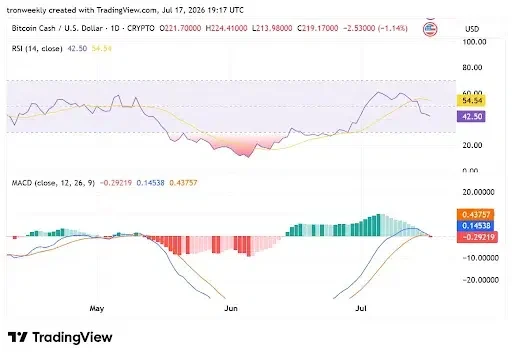
According to the TradingView chart, the RSI level stands at 42.50 while its moving average is at 54.54, indicating that the bullish sentiment is starting to dissipate.
The RSI has dipped below the 50 neutral level because it has been unable to sustain above that level, indicating that buyers are becoming exhausted.
Source: TradingView
The MACD is at the levels of 0.14538 for the MACD line, 0.43757 for the signal line, and -0.29219 for the histogram.
The negative histogram combined with the bearish crossover indicates weakening upward momentum. As the upward momentum is diminishing, the sellers’ influence increases, which increases the probability of further decline.
Following the cautious circumstances in the crypto market, the BCH price is moving in a neutral territory. However, if the BTC price starts to move upward and conditions become favorable, the BCH price could surge to new highs.
Also Read: BCH Price Surges: Is Bitcoin Cash Ready to Target $965 and Beyond?
This article contains market analysis and price predictions. These are not guarantees. Crypto markets are volatile. Always DYOR. Not financial advice.



Be the first to comment