



What to know:
- DOGE price tightens inside a triangle as buyers defend support near the $0.07150 zone.
- Liquidation bands between $0.071 and $0.0745 keep Dogecoin locked in a tight price band.
- The RSI at 36.50 and MACD histogram at 0.0003782 show weak but easing sell-side pressure.

The DOGE price is tightening inside a symmetrical triangle, with analysts watching for a breakout as buyers defend support and sellers hold descending resistance. Meanwhile, liquidation, RSI, and MACD data show weak momentum as Dogecoin remains in a narrow range on Monday, July 20, 2026.
As of writing, Dogecoin (DOGE) is currently trading at $0.07170, showing a decline of 1.32% in a day. The trading volume is showing a strong bullish surge up 48.55% and is now standing at $415.24 million. Over the last week, the token has lost 0.99% according to CoinMarketCap.
Also Read: SEI Price Prediction: Falling Wedge Signals Potential Rally to $0.40

How DOGE Price Triangle Setup Points to a Breakout
Analyst Crypto With Gopal pointed out that DOGE has become tighter within a symmetrical triangle. The price pattern is showing rising lows. Selling pressure is still being applied against the descending resistance trendline.
The analyst noted that the momentum is squeezing as DOGE approaches the point of the triangle. Buying pressure is also becoming aggressive in defending the support.

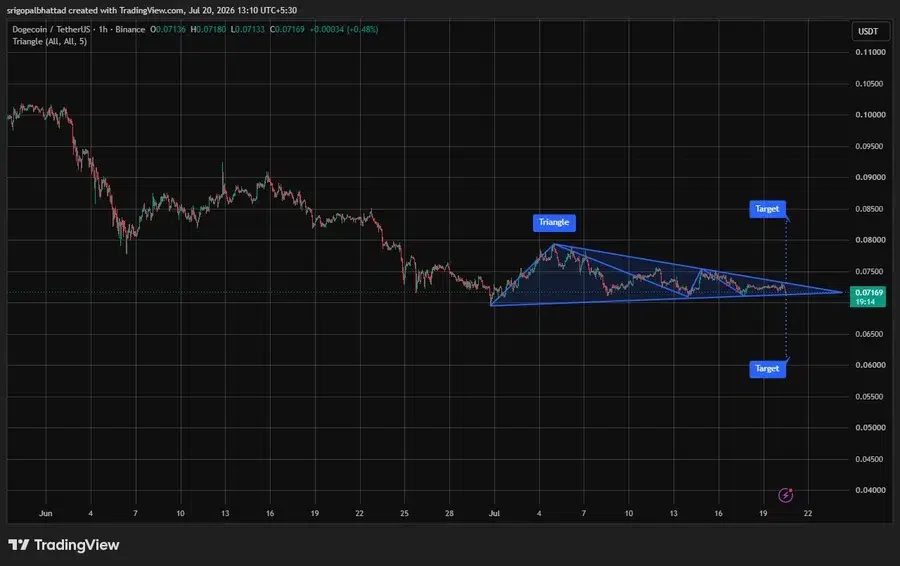
A bullish breakout above this resistance would be able to trigger the next upward wave according to the analyst. With a strong volume breakout above the upper trendline, DOGE can be getting ready for an expansive wave.
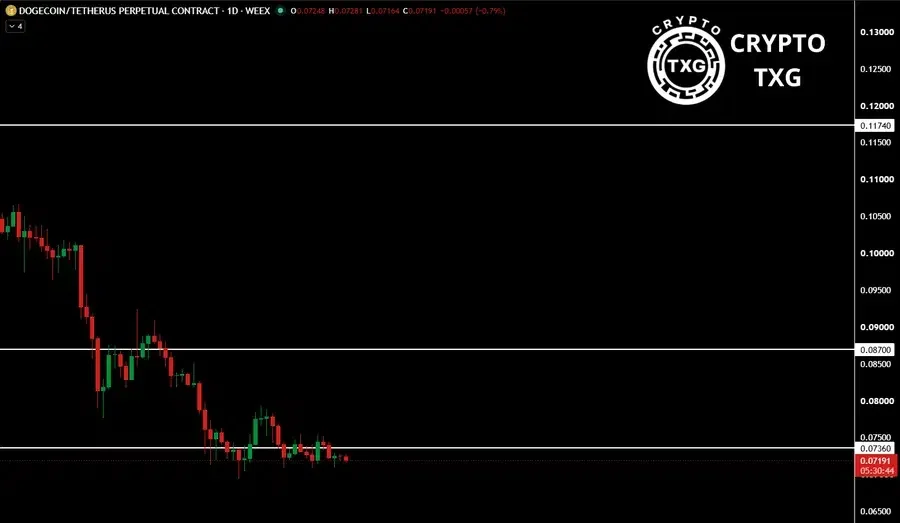
Moreover, another analyst, Crypto TXG, revealed that Dogecoin holds the $0.07150 support and bounces from that area. It indicates that buyers remained active at this lower range, but the bounce did not go all the way to the $0.087 resistance.
The analyst added that price later pulled back toward the same support level again. This kept the DOGE price inside a narrow consolidation phase. The token has been trading in this range for several days.
The analyst noted that the next move will depend on the outcome of the breakout. A bullish breakout above the range would help initiate a recovery process, while a breakdown of support would mean a continuation of the consolidation or bearish pressure.

Why DOGE Price May Retest $0.071 Support
The CoinGlass heatmap liquidations show that the price is trading within the narrow liquidity range from $0.071 to $0.0745. The most prominent upside liquidation bands are located at $0.0738 to $0.0745.
The mentioned zones can draw price attention if there is any increase in buying interest. The recent decline also swept liquidity near $0.071 before a brief bounce-up occurred.
It revealed the presence of buyers who tried to defend this price area for now. But weak follow-through could result in another test of $0.0708 to $0.0712 before an attempt at recovery.
What Technical Signals Reveal About DOGE Price
From a technical perspective, the Relative Strength Index (RSI) data confirms the bearish momentum of DOGE’s price. The RSI has the current value of 36.50, while the RSI moving average has the value of 36.58, which means that the indicator is below the 50 level.
This indicates that currently the sellers have the upper hand. In order to confirm momentum reversal, the RSI should rise above 50.
Moving Average Convergence Divergence (MACD) data indicates slight easing in downside momentum. The MACD line has the current value of -0.0021838, while the signal line is at -0.0025619.
The histogram is positive at 0.0003782. However, the DOGE price needs stronger confirmation through price structure and volume.
Also Read: DOGE Price Eyes $1.25 as Historic Chart Pattern Suggests Major Breakout



Be the first to comment