


Bitcoin has moved back above an important daily resistance level, placing the next Fibonacci barrier near $67,000 within reach.
Key Takeaways
- Bitcoin has broken above daily resistance near $64,000 while maintaining its higher-low structure.
- The next Fibonacci resistance sits around $67,000, followed by a larger test near $70,000.
- Spot Bitcoin ETFs recorded a second positive week after eight consecutive weeks of outflows.
- The monthly recovery remains conditional on reclaiming a long-term ascending trendline.
BTC trades at approximately $65,400 at the time of writing on July 20, with the recovery from its late-June low continuing to produce higher lows.
The daily setup is constructive, but the monthly chart shows that Bitcoin is still trying to repair damage to its longer-term structure. The difference between those two time frames makes the next price reaction particularly important.
Daily Breakout Opens the Route Toward $67,000
The daily chart shows Bitcoin moving above the horizontal resistance around $64,000. Price is also holding above the 50-day simple moving average near $63,189 and continues to respect the ascending trendline extending from the late-June bottom.
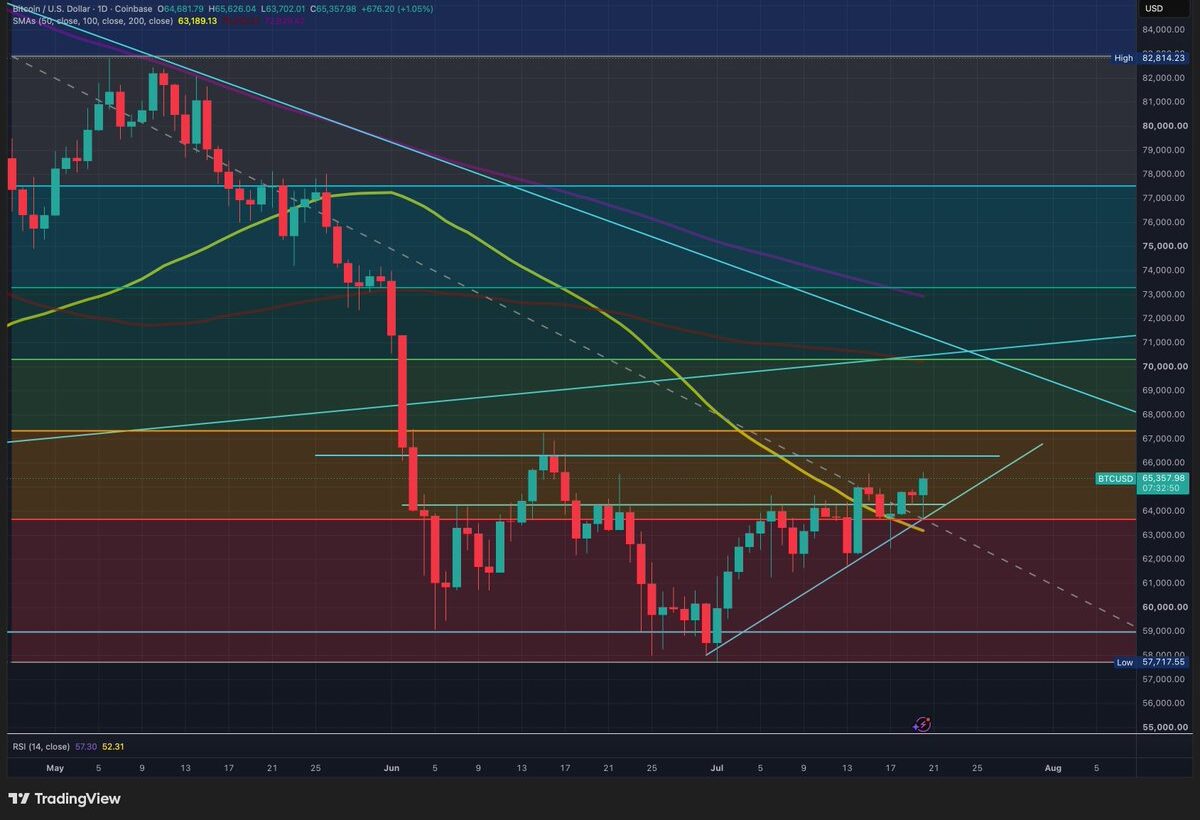
Together, these levels form the immediate support zone for the breakout. Holding above them would preserve the sequence of higher lows and leave the Fibonacci resistance near $67,000 as the next major test.
A move above $67,000 would strengthen the recovery, but the level may also attract selling because it marks the boundary between the current consolidation area and the next section of the broader range.
The first warning could be a daily return below the reclaimed $64,000 level. A subsequent break beneath the ascending trendline would turn the move into a possible false breakout and redirect attention toward the horizontal support.
The Monthly Chart Has Not Fully Recovered
Bitcoin’s monthly chart presents a more demanding test. Price previously fell below the long-term ascending trendline that had guided the broader advance, turning the former support into resistance.
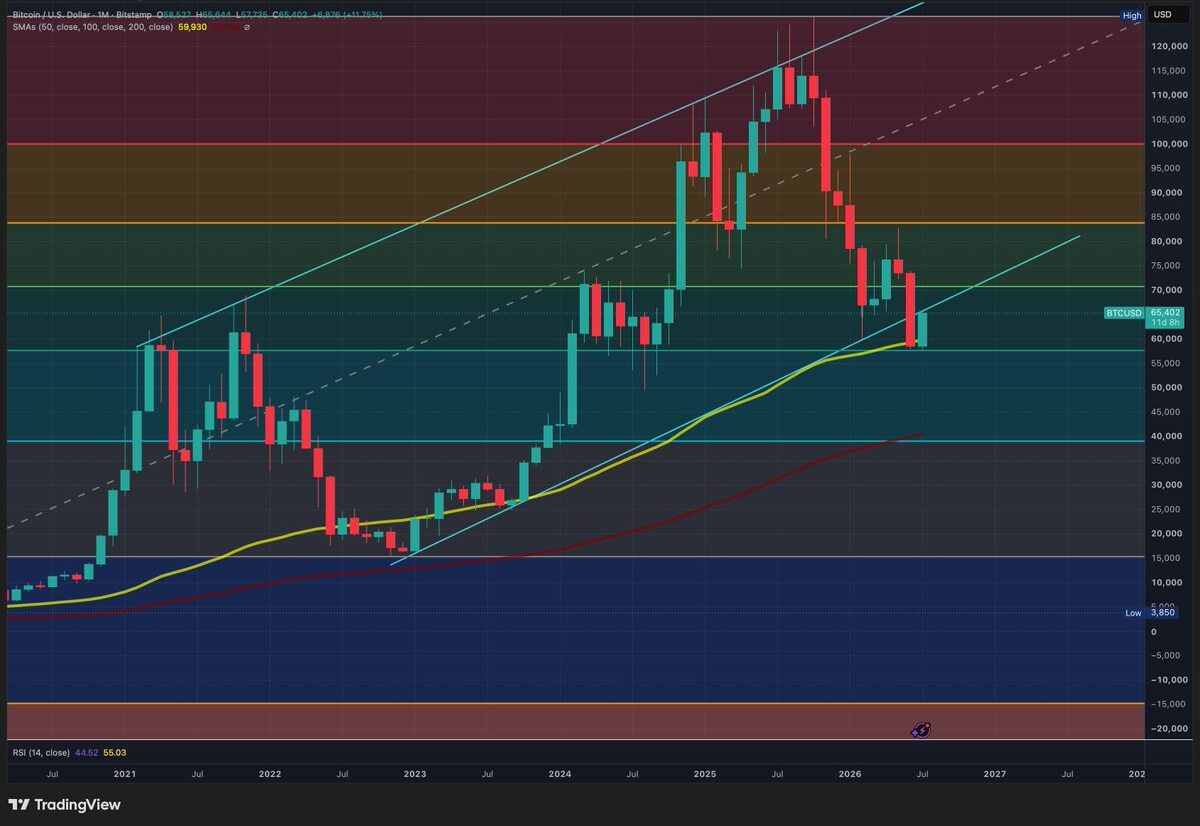
The latest rebound is now attempting to reclaim that line. It began after Bitcoin tested the area where the 0.618 Fibonacci retracement meets the 50-month simple moving average, currently near $59,930. That confluence provided bulls with a technically important area to defend.
A monthly close back above the ascending trendline would improve the longer-term structure and bring the 0.5 Fibonacci retracement near $70,000 into focus. Rejection from the trendline would leave Bitcoin vulnerable to another test of the $59,000 to $60,000 support region.
The daily breakout therefore supports a near-term bullish interpretation, but the monthly reclaim remains unconfirmed. Holding above resistance for several daily sessions is not the same as recovering the broader channel on a monthly closing basis.
ETF Inflows Return After Eight Red Weeks
Spot Bitcoin ETF flows have also improved. The funds attracted $197.40 million during the week ending July 10, followed by another $75.67 million in the week ending July 17, SoSoValue data shows.
That produced two consecutive positive weeks and combined net inflows of approximately $273.07 million after eight straight weeks of outflows. The reversal removes some of the persistent fund-related selling pressure that accompanied Bitcoin’s earlier decline.
However, the second weekly inflow was smaller than the first. The data shows that demand has returned, but not yet that it is accelerating. Continued positive flows would provide stronger support for a move through $67,000 and toward the monthly resistance near $70,000.
The bullish confirmation could be backed by a successful retest of the $64,000 breakout area, followed by a sustained move above $67,000. The stronger long-term signal would come from a monthly close that reclaims the lost ascending trendline.
The broader setup also entered a macro-heavy period shaped by three groups of catalysts in the following days: technology-sector earnings, central-bank and economic decisions and US-Iran developments, which could influence oil prices and wider risk appetite.
For now, buyers hold the advantage on the daily chart. The monthly structure remains at an inflection point, making $67,000 the first test and $70,000 the level that could determine whether the recovery develops into a larger reversal.
This article is provided for informational purposes only and does not constitute financial or investment advice.

Kosta has reported on cryptocurrency markets and blockchain infrastructure since 2020, bringing over six years of hands-on experience in the crypto industry built through daily tracking of markets, trends, and emerging blockchain developments. Specializing in Bitcoin on-chain analysis, institutional ETF flows, and digital asset price action, his work at Coindoo has been cited by other news agencies and consistently covers market developments with a focus on data-driven reporting across Bitcoin, Ethereum, Solana, and XRP.
Over the years, Kosta has contributed to multiple crypto media outlets in different regions, authoring over 6,000 articles across the sector. His reporting spans cryptocurrency markets and the broader fintech industry, tracking not only price action but also the technological and regulatory forces shaping the ecosystem.
To support his analysis, Kosta actively leverages on-chain data and metrics from leading platforms such as Santiment, Glassnode, and CryptoQuant, enabling deeper, evidence-based market insights. He believes in the power of transparency and the data that underpins the blockchain ecosystem.
His academic background in Marketing Management from Denmark further complements his analytical approach, adding a strong understanding of communication strategy and content positioning to his work.



Be the first to comment