



Key Takeaways
- Bitcoin whales added 66,700 BTC over 60 days as price rebounded to $65,420 on July 20.
- Short liquidations and a moving average convergence divergence ( MACD) bull signal drove Bitcoin above its 200-week average.
- Traders now watch $67,200 resistance as the Iran war keeps oil and BTC volatility high.
The move came after a hard drop on July 17, when BTC fell to $63,706 as U.S. stocks sold off and oil prices jumped on renewed Middle East fighting. By July 20, the price had recovered more than 3% from that low, and bitcoin’s market cap sat near $1.313 trillion.
The bounce did not happen in a straight line. Traders spent July 18 and 19 grinding through consolidation, with futures data showing closes between $64,120 and $64,270. Sentiment stayed mixed as war headlines rolled in, but the price action itself told a calmer story.
Chart patterns began forming higher lows through the period, the kind of setup that often comes before a broader move higher. By the time Monday’s session opened, buyers had done enough work to push bitcoin decisively back above the $65,000 launchpad.
Market data put bitcoin’s 24-hour range at $63,733 to $65,644, with Binance leading spot volume at 100,186.51 BTC traded, followed by Pionex, Toobit, WEEX and Bybit. Total 24-hour exchange volume across tracked markets ran close to $62.8 billion.

Whales Keep Buying Throughout the Chaos
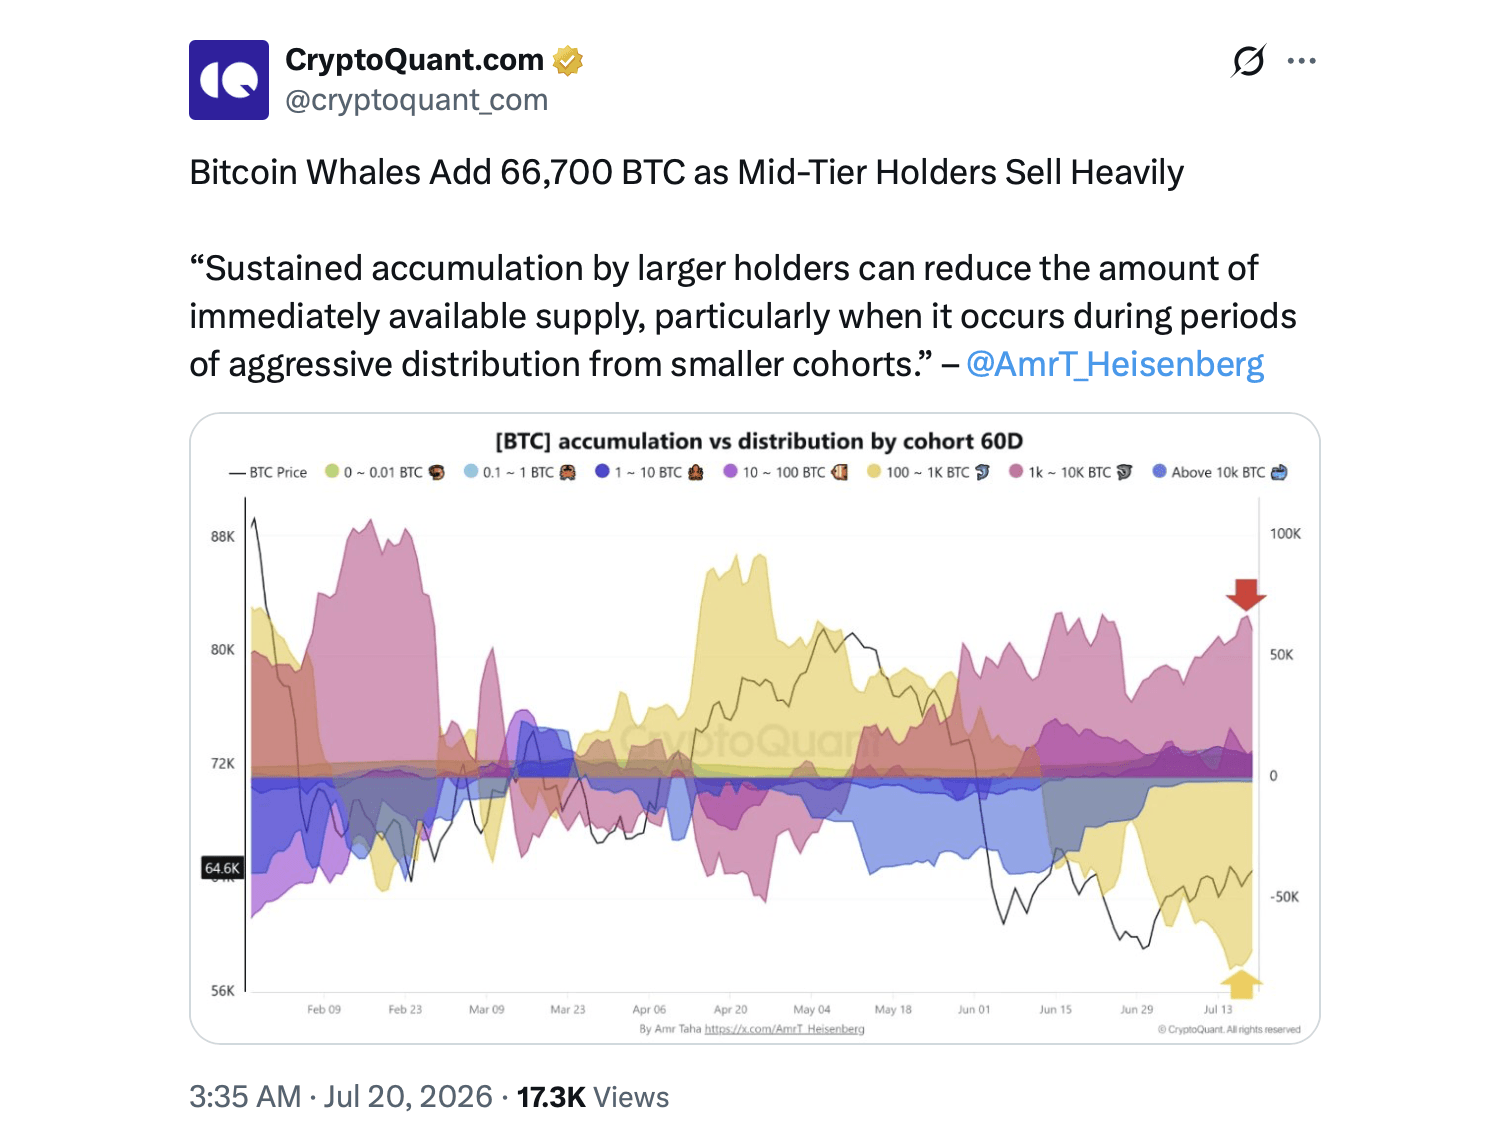
Onchain data from Cryptoquant.com shows large holders added about 66,700 BTC over the past 60 days, even as mid-sized wallets sold into the weakness. That kind of accumulation pattern has shown up before past rallies, with bigger wallets buying the dips that shake out smaller holders.
Short positions took the other side of the move. As bitcoin pushed back above $65,000, traders holding short bets, around $45 million, were liquidated, adding fuel to the bounce. A bullish MACD crossover formed alongside the move, and an engulfing candle pattern on the daily chart stayed intact through the recovery.
The rally left bitcoin above its 200-week moving average for a third straight week, and the weekly close marked the strongest in five weeks. That average has served as a long-term floor through past cycles, and holding above it gives bulls a technical argument that the broader trend remains intact despite the geopolitical noise.
Iran War Keeps Traders on Edge
The price swings tracked closely with developments in the Iran war. A ceasefire and memorandum of understanding reached in June began breaking down in July after Iran targeted vessels in the Strait of Hormuz. The U.S. resumed strikes on Iranian ports, islands, and infrastructure, and Iran hit back at U.S. allies in the region. The latest escalation is now in its ninth day of U.S. airstrikes against Iran.
U.S. Central Command (CENTCOM) reinstated a naval blockade on ships moving through Iranian ports, and reports pointed to American service member deaths tied to the fighting. President Trump signaled openness to further escalation while still leaving room for negotiations, with Qatar named as a possible venue for talks. Oil prices spiked on the news, adding inflation worries to an already jumpy market.
Risk assets sold off on July 17 as the conflict escalated. Bitcoin followed stocks lower before finding buyers at the $63,000 level and turning higher into the weekend. That pattern, a sharp risk-off dip followed by a recovery, has repeated through much of the war. Crypto traders have increasingly treated bitcoin as both a risk asset that sells off with stocks during acute shocks and a longer-term hedge that draws buyers once the initial panic fades.
What the Charts Show
Technical and oscillator data reads neutral overall, with a 14-day relative strength index ( RSI) of 58 and a Stochastic reading of 86, both in neutral territory via the daily chart. The MACD level came in at 353, a bullish signal, and short-term moving averages across the 10, 20, 30, and 50-day windows leaned bullish as well.
Longer-term averages tell a different story. The 100 and 200-day moving averages point to sell, with resistance building near $68,000 to $74,000. That split between short-term buy signals and longer-term sell signals is part of why the overall moving average read on bitcoin stays fairly neutral even as the price recovers.
Classic pivot points put resistance at $68,995 and support at $63,250, with a wider band down to $53,046 marking the outer edge of the current range. BTC/USD pair charts across the daily, four-hour, and one-hour windows show the same story: consolidation near the $65,000 zone with buyers stepping in on dips toward the low $63,000s, and short-term momentum favoring the bulls as long as that level holds.
What This Means for Traders
Bitcoin’s bounce off $63,000 lines up with a pattern of higher lows that traders have been watching for weeks. A break above $65,500 to $67,200 would open the door to a retest of resistance near $68,000. A failure to hold $64,800 to $63,000 support would put the low $60,000s back in play.
Ethereum moved in step with bitcoin, trading near $1,900 as the broader crypto market, valued at around $2.23 trillion, followed BTC’s lead.
None of this happens in a vacuum. As long as the Iran war stays unresolved, oil prices and stock market swings will keep bleeding into how bitcoin trades day to day. Analysts following the setup point to $67,000 as the next real test. A clean break above that level would put bitcoin in a position to challenge the $68,000 to $74,000 zone where the longer-term moving averages sit.
Failure to clear resistance, especially if the war escalates further, could send the price back toward the $58,000 to $64,800 range that traders have flagged as a cycle low candidate.
For now, bitcoin’s price action reflects two forces pulling against each other. Geopolitical risk keeps pressuring the market lower in short bursts, while whales, short covering and technical buy signals keep pulling it back up. That tug of war looks set to continue as long as the war and the ceasefire talks that follow it remain unresolved.




Be the first to comment