



XRP traded between $1.09 and $1.10 on July 21, 2026, consolidating after this month’s rally, with technical coverage split between a bullish breakout setup and a bearish descending channel structure still capping every recovery attempt.
Ripple’s Payments Push and Institutional Flows
Ripple Payments is now live in more than 90 payout markets, letting banks and payment service providers settle cross-border transactions in seconds, with growing use across Asia, Europe, Latin America, and the Middle East. For more on how Ripple and XRP are developing, our coverage of Ripple Payments expanding into Japan covers one of the specific regional partnerships behind the company’s growth.
However, not all of these payments use XRP directly, but broader familiarity with Ripple’s payment rails is seen as a path toward greater XRP Ledger adoption over time. Ripple’s RLUSD stablecoin is playing a distinct role in this ecosystem, providing payment stability while XRP itself continues to serve on-demand foreign exchange and settlement liquidity.
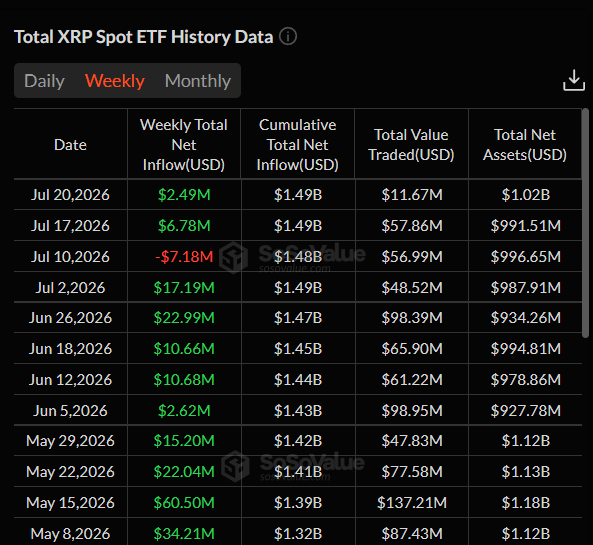
Institutional flows also showed a modest turnaround as spot XRP ETFs attracted nearly $7 million in inflows last week, according to SoSoValue data, following roughly $7 million in outflows the week before, with cumulative inflows now at $1.49 billion and average net assets of $991 million.

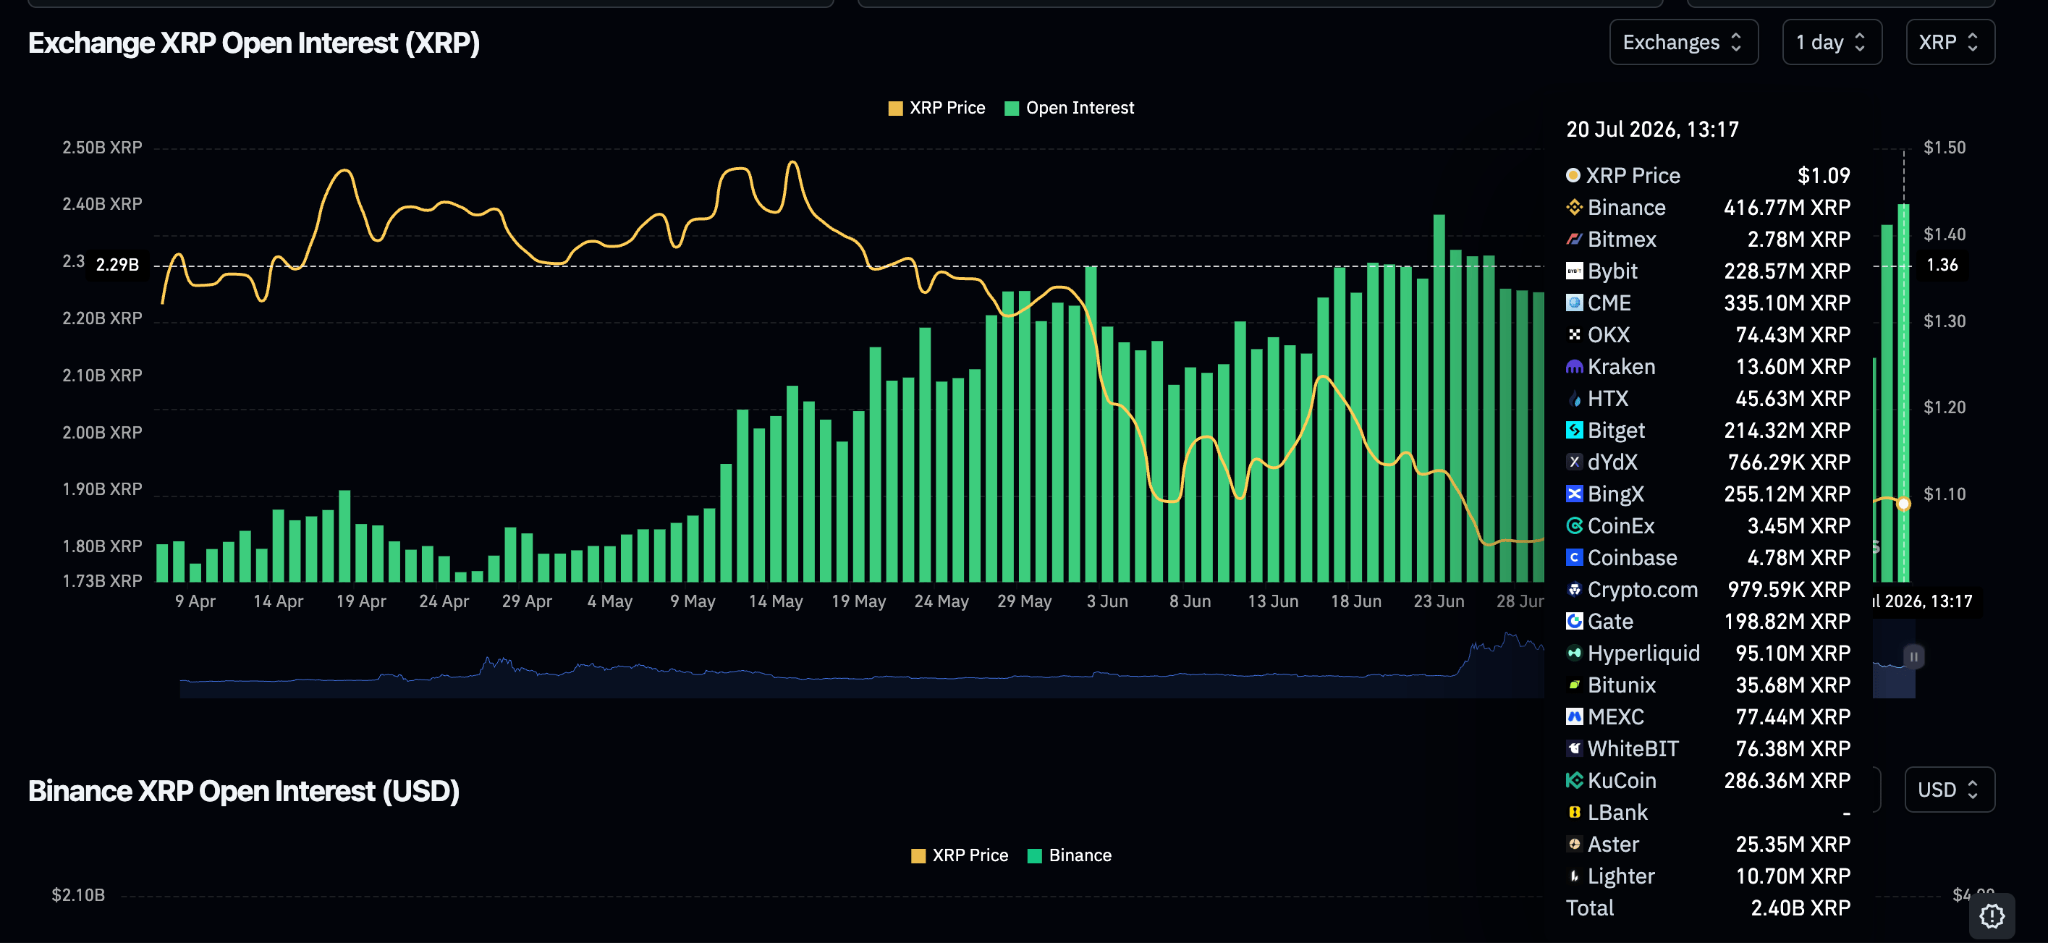
Separately, XRP perpetual futures open interest rose to 2.4 billion XRP on Monday, up from 2.13 billion the prior day and 2.09 billion on July 7, according to Coinglass data, pointing to gradually rebuilding derivatives demand.
The On-Chain and Derivatives Picture for XRP
Beyond price charts, active XRP addresses have fallen to around 20,000, their lowest level in nearly a year, according to Glassnode, suggesting declining network participation even as price holds above $1.
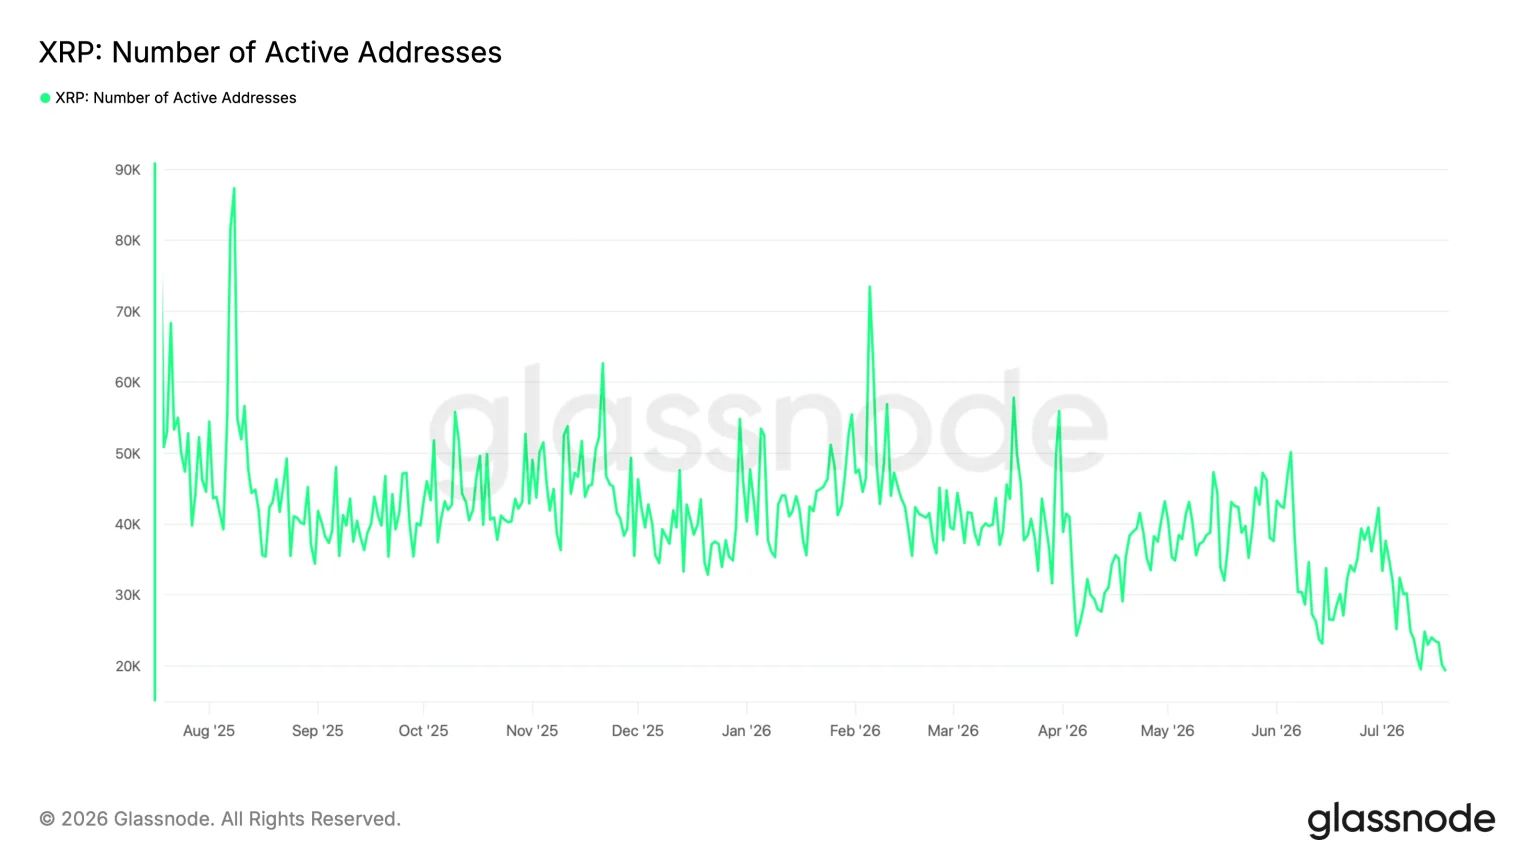
Weakening on-chain activity doesn’t guarantee further downside on its own, but it does point to a lack of conviction among market participants that would need to reverse before a durable recovery looks likely.
On the derivatives side, XRP whales added roughly 70 million tokens as of July 16, and top traders on Binance were positioned overwhelmingly long, with a long-to-short ratio of 3.44.
Despite this, funding rates have stayed close to zero and long and short liquidations remain roughly balanced, a setup analyst PelinayPA described as unlikely to produce a major squeeze in either direction absent an outside catalyst such as a Bitcoin price move.
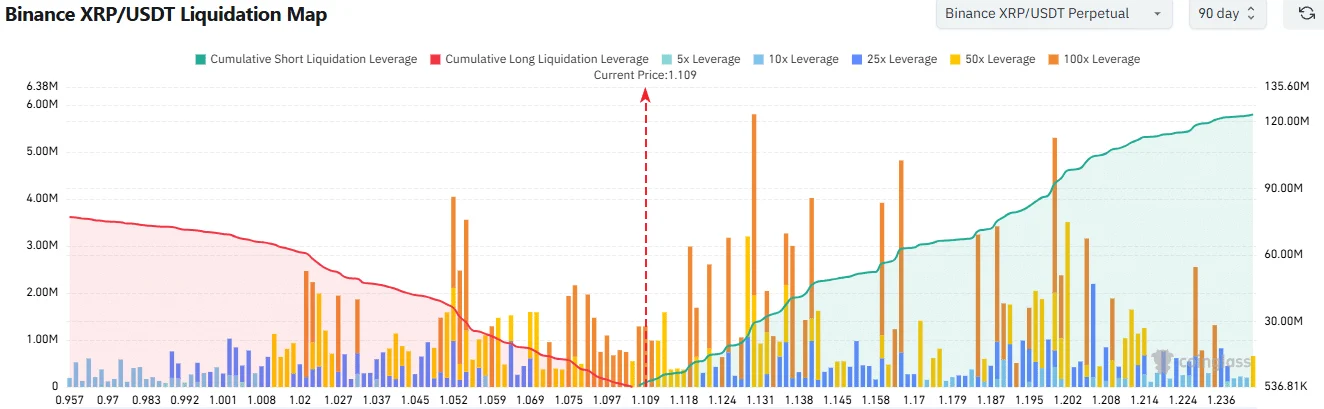
CoinGlass data shows cumulative short liquidation leverage of $102.2 million built up to $1.202, compared with $61.17 million in long leverage down near $1.02, suggesting price could get pulled toward the heavier liquidity cluster before any larger directional move plays out.
Technical Analysis Outlook for XRP
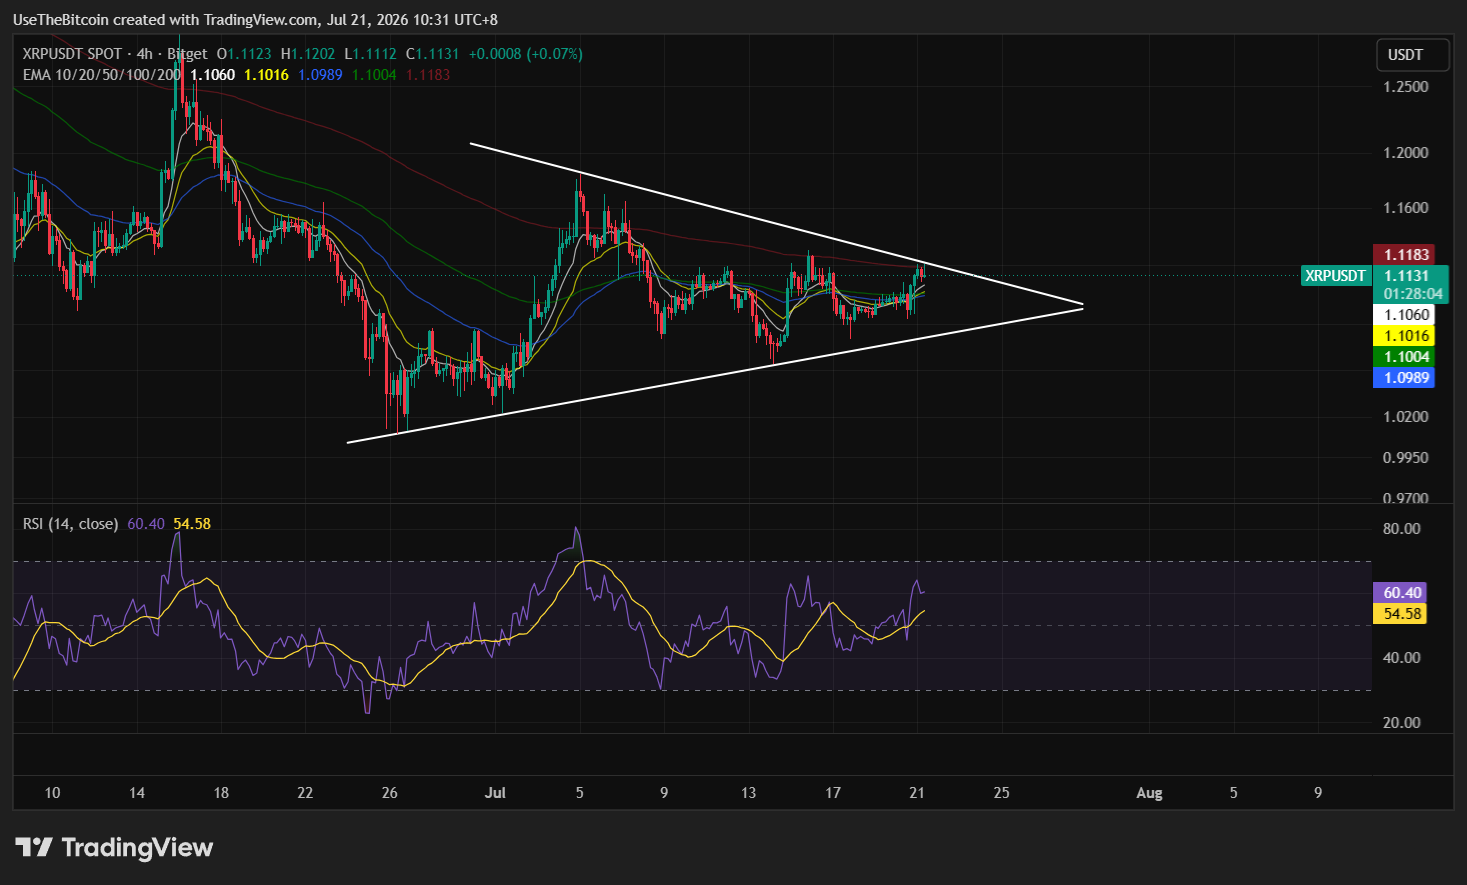
On the 4-hour timeframe, XRP is coiling inside a symmetrical triangle, with the 50-period EMA flattening beneath price and the RSI at 60, concluding the most likely outcome is bullish, with a break above $1.126 confirming a move toward $1.156 and $1.183.
However, on the cautious side of things, XRP is trading inside a descending channel on the daily chart, with exponential moving averages sloping lower and capping every recovery beneath the $1.24 to $1.29 zone.
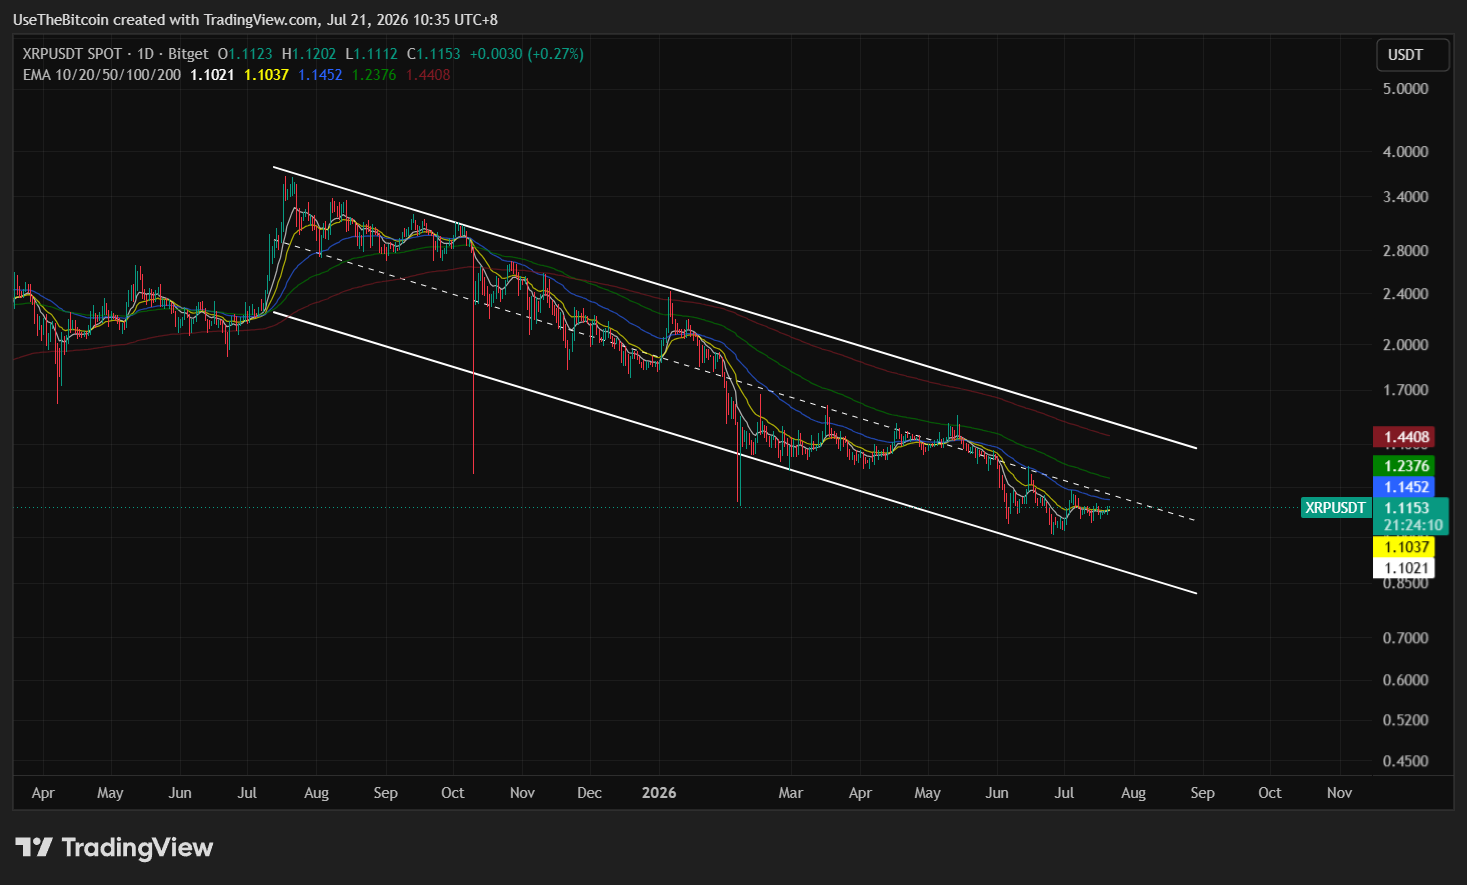
Therefore, the swing structure is still considered bearish despite a recent breakout attempt from a descending wedge, saying XRP needs a close above $1.29 to flip that structure bullish, and must be able to retest the $1.18 to $1.23 zone rather than chase strength.
| Level | Role | Notes |
| $0.88–$0.92 | Deeper demand zone | Exposed only if the $1.02–$1.06 support breaks |
| $1.00 | Psychological support | Key level to watch given weakening network activity |
| $1.02–$1.06 | Primary demand zone | Repeatedly defended in recent weeks across daily and 4-hour charts |
| $1.089 | Rising trendline support | 4-hour bullish structure level |
| $1.126–$1.18 | First resistance cluster | Described as a triangle breakout target on one read, a trendline cap on another |
| $1.20–$1.23 | Supply zone | Local resistance tied to heavy short liquidation leverage |
| $1.24–$1.29 | Major overhead resistance | 100-day EMA, bullish flip level, and daily supply zone across different analyses |
| $1.45 | 200-day EMA | Longer-term resistance |
Major Events and Catalysts to Watch for XRP
Several scheduled events could move markets this week. Earnings from Alphabet and Tesla could shift broader risk sentiment across technology and crypto markets, while weekly jobless claims land on Thursday and flash PMI data on Friday.
Additionally, the Federal Reserve meets at the end of the month on July 28 and 29, and continued upward pressure on Treasury yields could keep weighing on crypto even if XRP-specific fundamentals keep improving.
Whether active addresses and trading volume begin recovering alongside price is likely to matter more for the durability of any rally than a single breakout above near-term resistance.
This article is for informational purposes only and does not constitute financial advice. Crypto price predictions are based on analyst estimates and are not guarantees of future performance. Do your own research before making any investment decisions.
Frequently Asked Questions
Need a refresher? Here are the questions traders are asking about XRP this week.
Why do analysts disagree on XRP’s trend right now?
One technical read sees XRP forming a bullish triangle with strengthening momentum, while others describe a descending channel or wedge still capping every recovery attempt. The underlying support and resistance levels are broadly consistent across both readings; the disagreement is about which pattern the current price action confirms.
What would confirm a bullish breakout for XRP?
XRP would need to close decisively above the $1.126 to $1.18 resistance cluster and hold there, with a further move above $1.24 to $1.29 needed to flip the broader daily structure bullish on the more cautious reads. A brief wick through resistance without holding above it would not count as a confirmed breakout.
What would signal further downside for XRP?
A sustained break below the $1.02 to $1.06 demand zone would expose the deeper $0.88 to $0.92 support region. Declining active addresses and trading volume alongside a break of that support would add further weight to a bearish case.
What does XRP’s declining network activity mean?
Active XRP addresses have fallen to around 20,000, their lowest level in nearly a year, pointing to weaker day-to-day usage of the XRP Ledger even as price holds above $1. This doesn’t guarantee further price weakness on its own, but it does suggest a lack of fresh participation that would need to reverse for a rally to look durable.
Are XRP ETF flows improving?
Spot XRP ETFs saw nearly $7 million in inflows last week after roughly $7 million in outflows the week before, a modest but positive turnaround. Cumulative inflows stand at $1.49 billion, though sustained inflows would likely be needed to meaningfully offset ongoing selling pressure in the spot market.



Be the first to comment