




TLDR
- SOL is trading around $76 and testing a key support level that could decide its next move
- Over $26 million in cross-chain assets flowed into Solana in the past seven days
- Bulls need to hold $74–$75 support to keep the recovery on track
- A breakout above $82–$85 could open the door to $94 and then $125
- Losing support could push SOL down to the $64–$70 range
Solana (SOL) is trading at $76.17 at the time of writing, with a market cap of $44.4 billion and a 24-hour trading volume of $1.8 million.
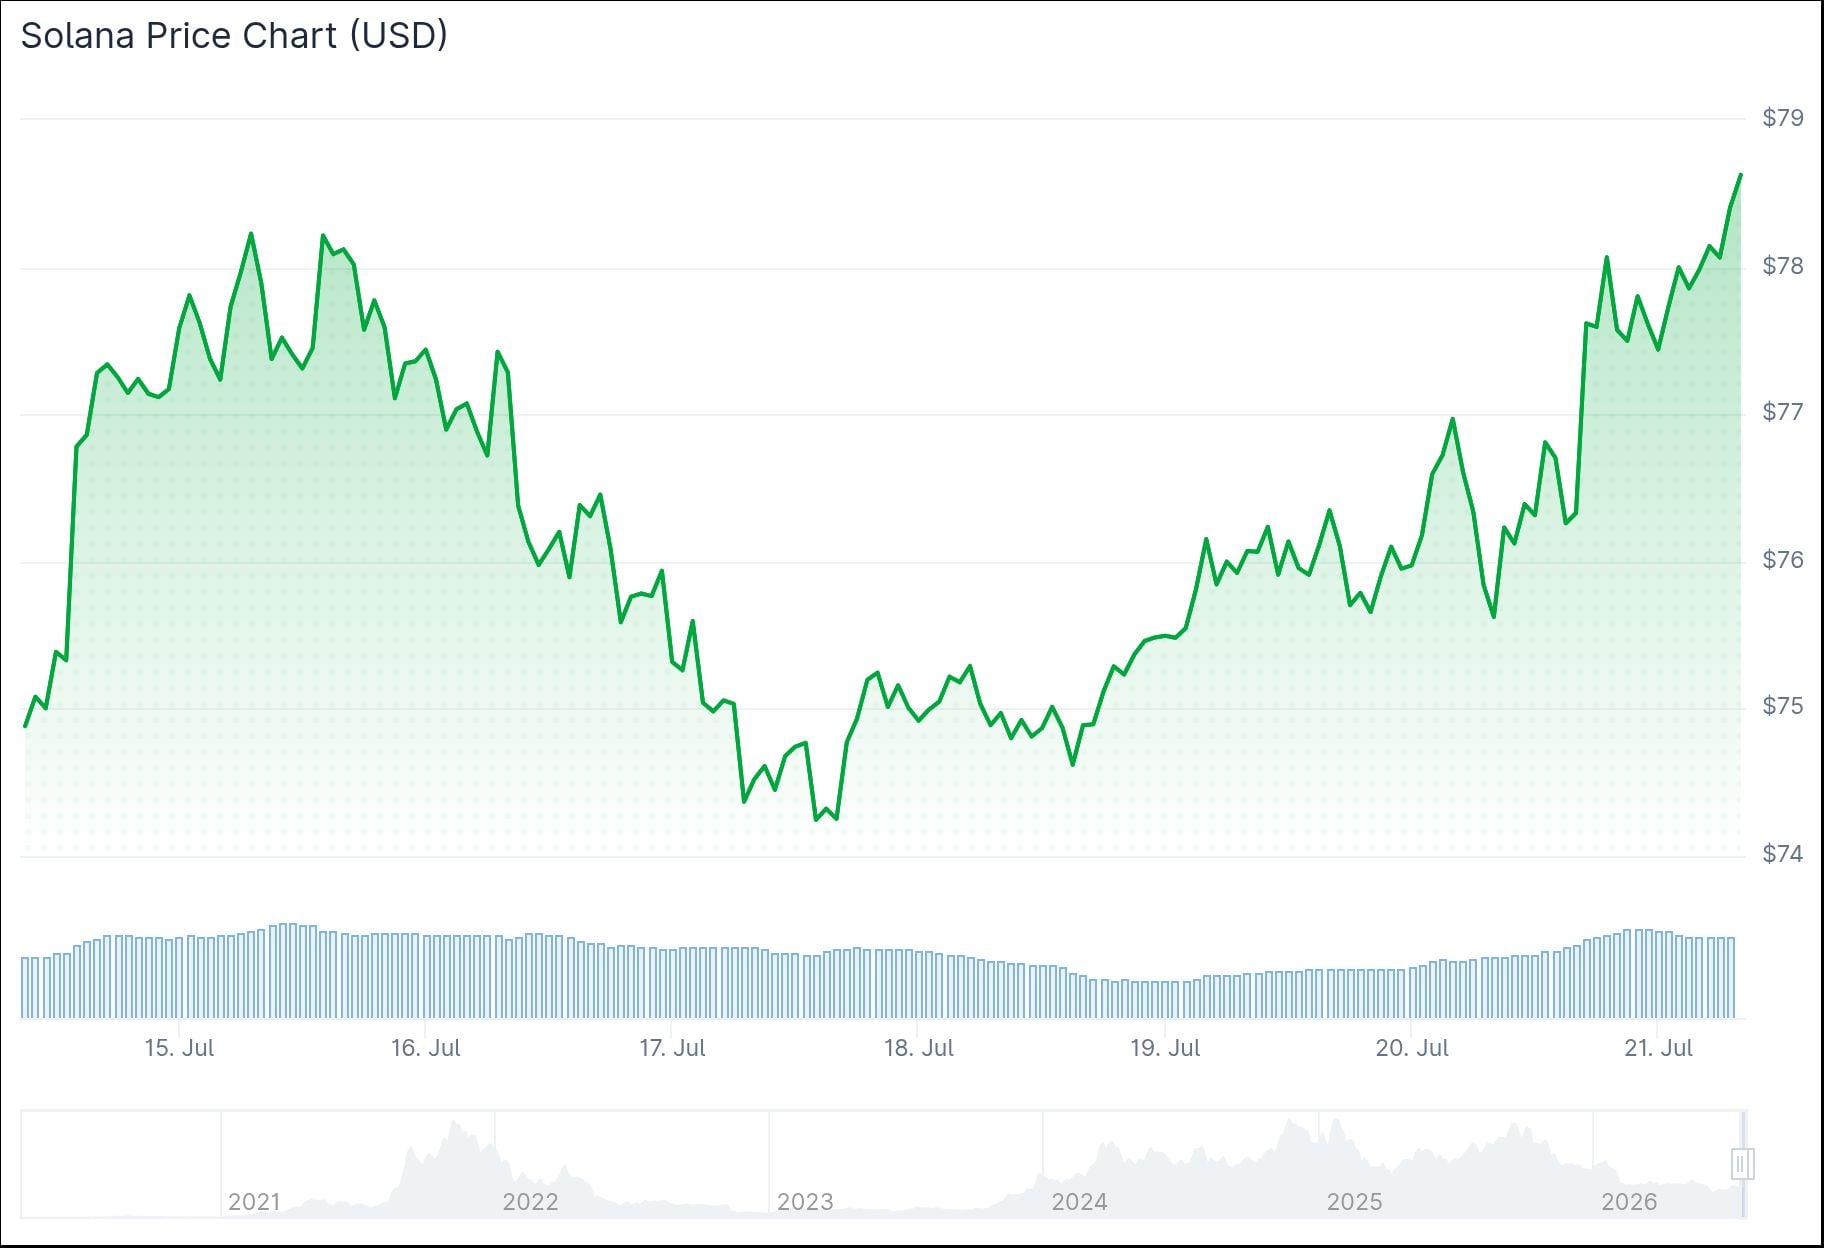
The price has been hovering near a key support zone, and where it goes next depends heavily on whether buyers can hold that level.
Analyst Daan Crypto Trades flagged that SOL is approaching a decisive high-timeframe technical zone. He noted that buyers need to defend the current level and form a higher low to keep the bullish market structure intact.
$SOL Key high timeframe region. Either the bulls push through and set a higher low here to take a stab at the range high in the $90s.
Or this rejects here and driblles back down to that mid $60s area. pic.twitter.com/Jn8pu28cjG
— Daan Crypto Trades (@DaanCrypto) July 20, 2026
If they do, the next target is resistance near $97, the upper boundary of the current trading range.
If support fails, experts say SOL could drop to the mid-60s, where previous demand was seen. Specifically, the $64.69 level has been cited as a larger support area below current prices.
Elliott Wave Setup Points to $82–$94
On the one-hour chart, SOL is testing the 38.2% Fibonacci support near $74. In the bullish scenario, this marks the end of a corrective pullback before another leg higher.

The first resistance sits between $78.40 and $82.30. A clean break above that zone would target $89–$94.
A break below $74 could extend the correction to $71.17, then $68.42.
$26M in Cross-Chain Inflows
Data from Solana Floor shows more than $26 million in assets bridged to Solana over the past seven days.
This kind of inflow reflects renewed interest in the network. Solana’s fast transactions, low fees, and active DeFi ecosystem continue to attract capital from other chains.
Analyst Crypto Patel shared his view on X, warning that losing the current rising channel could lead to a move toward the $70–$50 accumulation zone. He wrote that long-term he remains highly confident SOL can reach $500, then $1,000, calling the $70–$50 range a high-conviction accumulation zone for patient investors.
$SOL Is Sitting At A Critical HTF Decision Point.
Lose This Rising Channel And A Move Toward The $70–$50 Accumulation Zone Becomes Increasingly Likely. Bulls Must Defend.Long Term, I’m Highly Confident $SOL Can Reach $500, Then $1,000. That’s Why $70–$50 Looks Like A… pic.twitter.com/UbSpmy7dwD
— Crypto Patel (@CryptoPatel) July 20, 2026
On the weekly chart, Solana is defending a support area near $75 that previously launched a rapid move toward $140. The weekly RSI is forming higher lows near support, a pattern that suggests downside momentum may be easing.
The 20-week EMA near $85 is the first hurdle, followed by a resistance cluster around $110–$125. A break above $125 would bring the yearly open near $143 into view.
The $26 million in weekly cross-chain inflows remains the most recent data point supporting continued ecosystem activity on Solana.



Be the first to comment