



What to know:
- XRP trades near $1.13 as buyers test resistance at $1.145 and target a $1.23 reclaim.
- Ripple’s MiCA approval opens access to 30 EEA markets and supports broader XRPL usage.
- EMA and RSI readings improve, but major resistance remains above the current XRP price.

XRP price analysis for Tuesday, July 21, 2026, highlights improving market momentum after the token moved above short-term resistance. The latest chart shows buyers attempting to sustain the recovery while broader trend barriers remain intact.
As of writing, XRP is trading around $1.13, having risen by 3.34% in a day. XRP opened at $1.11152 and reached an intraday high of $1.13715 during active trading.
XRP has marked a low of $1.11043 and closed at $1.13230. CoinMarketCap data shows 62.47 billion XRP tokens in circulation, with a market capitalization of about $70.8 billion, ranking it sixth among cryptocurrencies.

Also Read: Worldcoin ETF Filing Marks Grayscale’s Push to Launch First US WLD Fund
Why Ripple’s European License Matters for XRP Adoption
Ripple recently received a regulatory boost in Europe. The firm obtained complete authorization under the Markets in Crypto-Assets framework on July 6 after preliminary approval in late June.
This license will allow Ripple to conduct operations in 30 countries of the European Economic Area. It eliminates the need for separate authorizations in different jurisdictions and makes it more attractive for banks, payment solutions providers, and fintech companies.
Ripple Payments is currently operating in 90 payout markets. The system processes millions of US dollars in volume and can make transactions in fiat currencies, stablecoins, and XRP.
Higher use of payment results in increased activity on the XRP Ledger. This also supports continued demand for services and assets within the XRPL ecosystem.
What Could Drive XRP Toward $31.65
Analyst Egrag Crypto shared a long-term roadmap to XRP’s triple-bottom formation. According to him, the chart illustrates the development of sequential rising cyclical lows in the market structure.
It is mentioned that the third bottom forms in the $0.90-$1.00 region. Nonetheless, the analyst emphasized that the pattern lacks complete confirmation yet.
The XRP price analysis identified $1.23 as the first level of reclamation in Egrag’s roadmap. Structural confirmation is placed at $1.56, while the main breakout zone is located in the $2.38-$3.54 range.

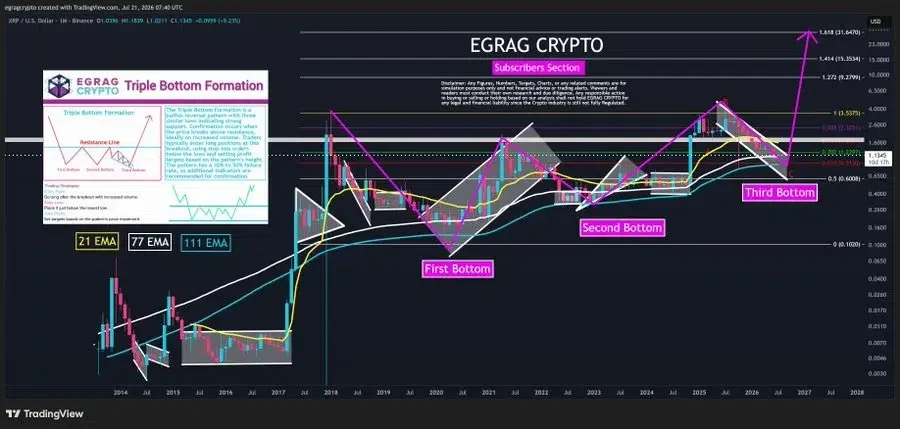
In his Fibonacci projections, he set $9.28 at 1.272 and $15.35 at 1.414, and the 1.618 projection goes to $31.65.
The accumulation near the macro support level could offer traders the opportunity to play bigger targets. The targets were related to the confirmation of the breakout structure, not the confirmed results.
How EMA and RSI Shape the XRP Price Analysis
From a technical perspective, the TradingView chart shows a 20-day EMA at $1.10456 and a 50-day EMA at $1.14500. Currently, XRP trades above the 20-day but under the 50-day average level.
The 100-day EMA is at $1.23706, while the 200-day EMA is set at $1.44027. Both long-term averages still stay above the XRP price near $1.13.
The momentum indicator readings improved significantly. The Relative Strength Index (RSI) reached 55.16, while the moving average is 46.41. It puts the indicator above 50 levels but below the overbought zone.
The XRP price analysis now focuses on the resistance zone at $1.14500 and the reclamation level at $1.23. A breakdown below the 20-day average will move attention back to nearby supports.
Also Read: Injective MiCA Whitepaper Strengthens INJ’s Regulatory Position Across Europe


Be the first to comment