



Bitcoin [BTC] surged past the $66,000 mark for the first time since the 17th of June.
The move tracks a broader market recovery playing out across altcoins, with the total crypto market capitalization crossing $2.25 trillion on the back of the rally.
Yet the data shows Bitcoin may still be undervalued at its current price, and the question is whether investors will treat that discount as a reason to accumulate the asset.
An undervalued Bitcoin
A recent CryptoQuant report, analyzing the Market Value to Realized Value (MVRV) percentile, places Bitcoin at an undervalued level.

The MVRV percentile measures where Bitcoin trades at any given moment against its performance over time, framing the asset’s current standing relative to its history in the market.
At press time, the metric sat at the 5th percentile, meaning Bitcoin traded lower than 95% of its historical readings. In plain terms, the asset was significantly undervalued at its present price level.
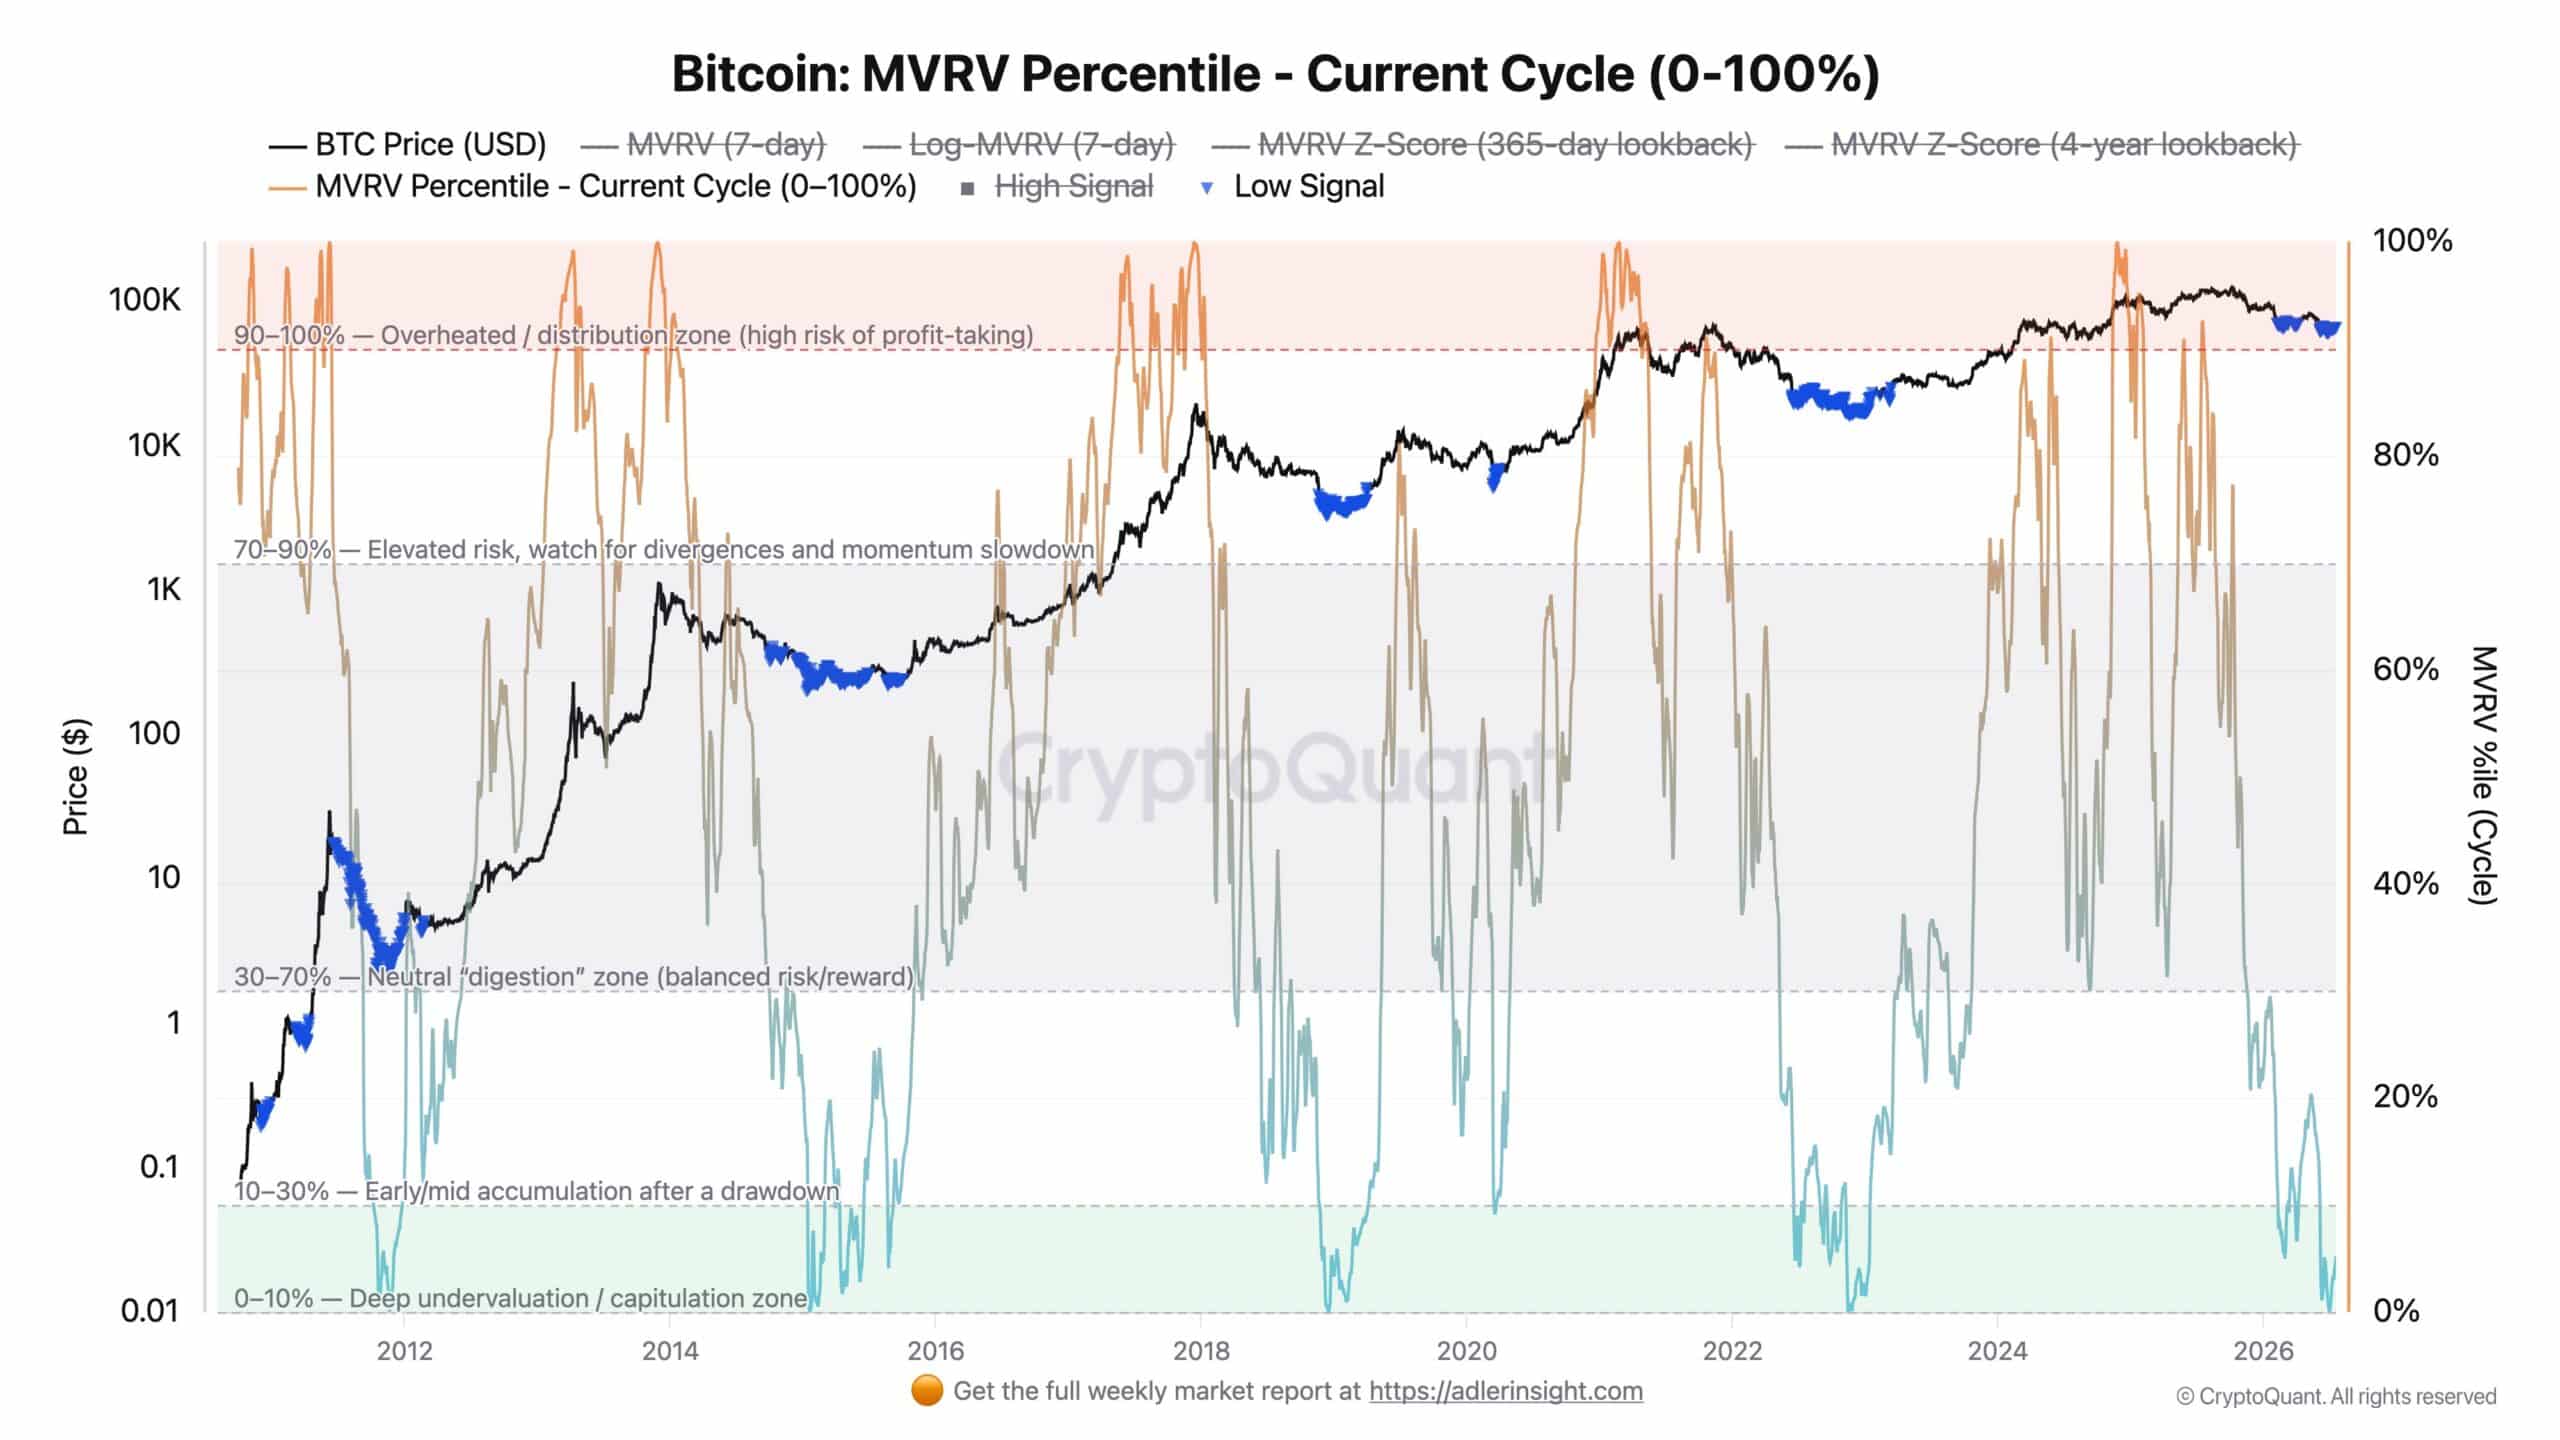
This zone has historically acted as a catalyst, as the 2023 case showed when it preceded a sustained rally over the following months.
On shorter timeframes, the percentile slipped to the 10th as the price fell toward the $60,000 region, and a rebound followed that carried Bitcoin to a local high of $82,850. A similar setup could repeat, though whether it produces another local high or a longer-term run remains unclear as market dynamics shift.
The market still holds a neutral stance
Spot market activity, where traders hold and exchange actual Bitcoin without leverage, points to neutrality, with neither bulls nor bears taking control.
The Spot Taker Cumulative Volume Delta (CVD), which tracks the gap between buyer and seller volume to show where the spot market leans, confirms that balance.
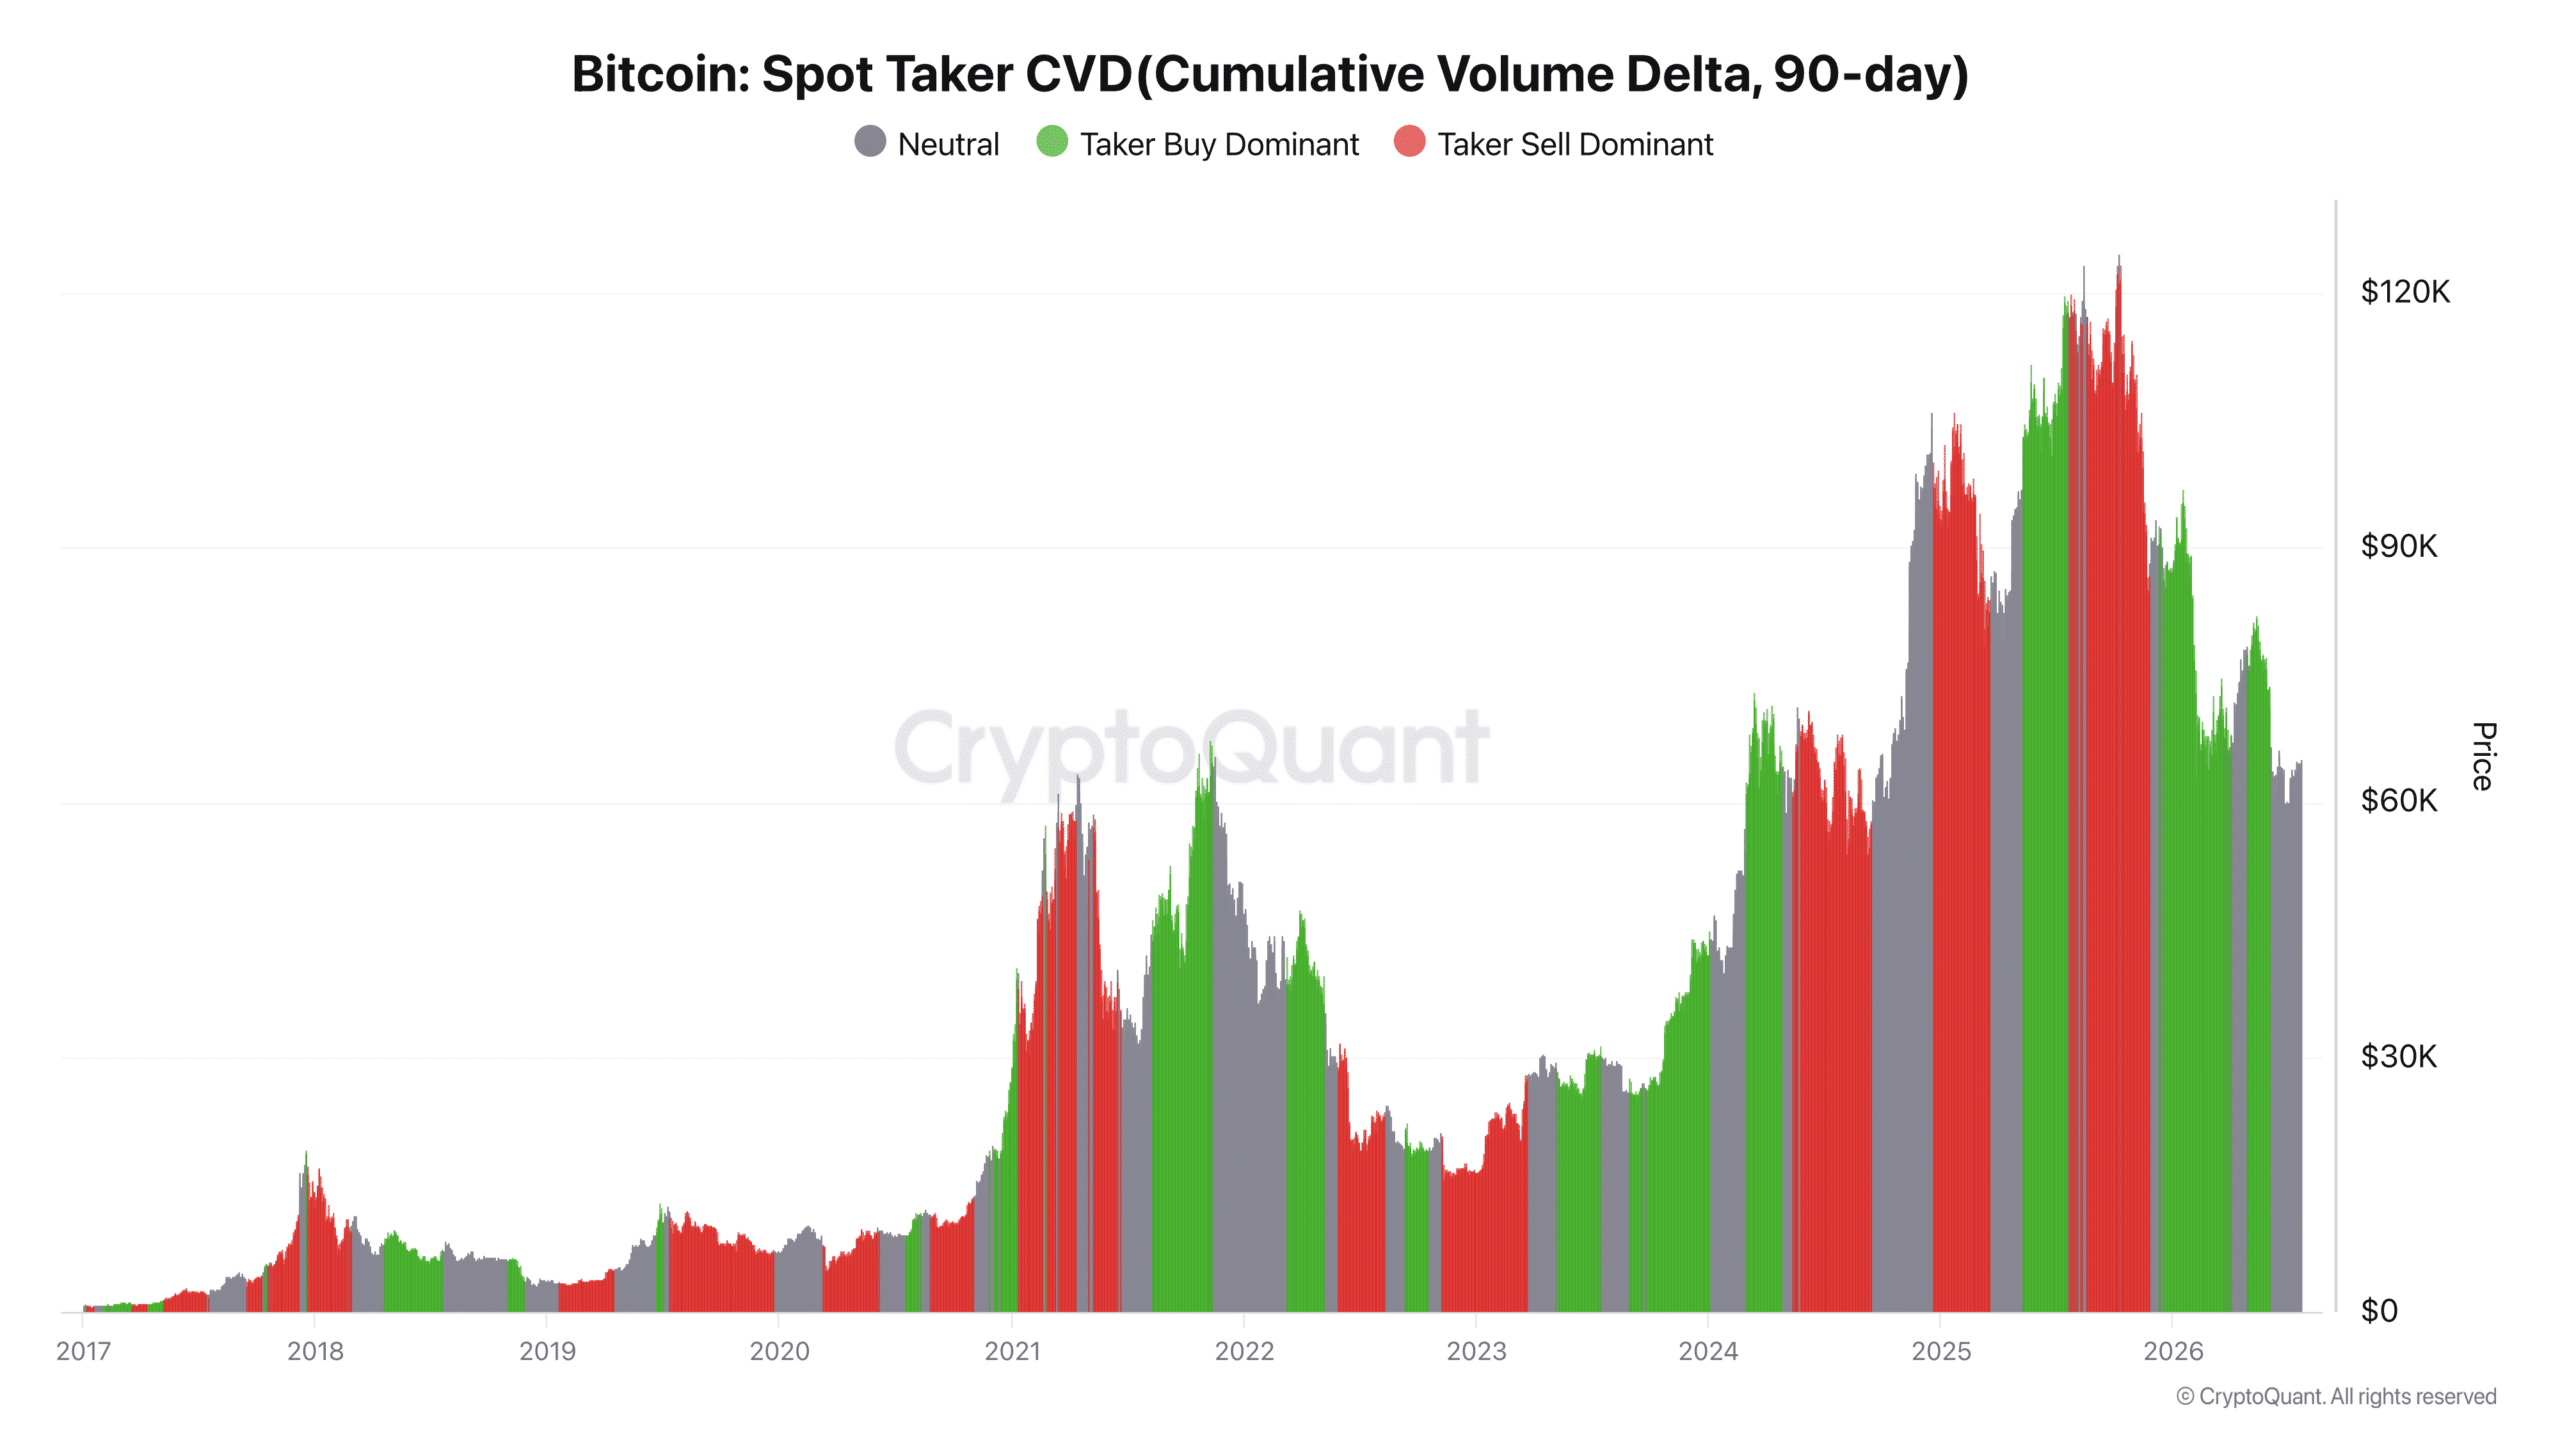
Despite the turbulent price swings of recent weeks, the CVD has held its equilibrium as far back as the 14th of June, keeping buying and selling evenly matched. The market needs to commit to a definite side before price can extend a directional run.
Reinforcing that read, spot trading activity measured through the 365-day Moving Average shows retail traders sitting on the fence. The total trade reading came in at negative 3.994 million, just 0.04% in relative terms, which keeps the activity firmly in neutral territory.
What’s going on in BTC’s spot market?
Spot market capital flow reflects how traders engage with the asset, and it shows mostly accumulation—though a weakened one rather than a strengthening drive.
Spot Netflow points to roughly $34.66 million accumulated over the past 24 hours, about $277.03 million across the past seven days, and close to $1.22 billion over the last 30 days.
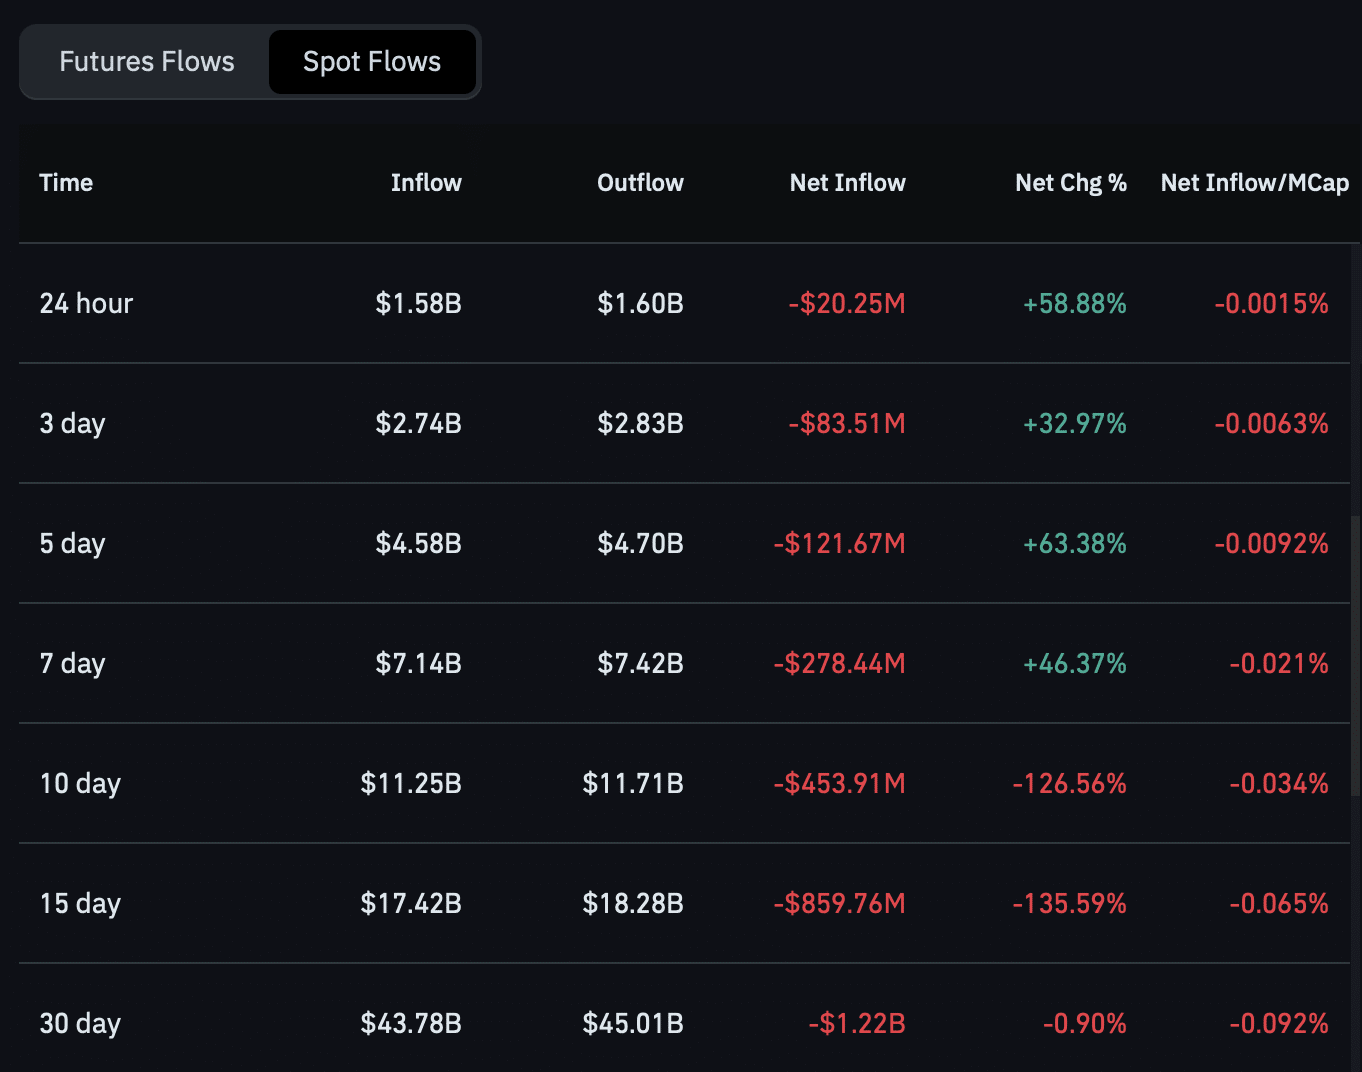
The accumulation stays minimal for a move that needs more fuel to push higher, and stronger buy volume would be required to drive the rally further.
Whether Bitcoin sustains its recent $66,000 surge hinges on a meaningful pickup in spot Netflow, which for now stays too soft to call the market decisively bullish.
Final Summary
-
Bitcoin’s move past $66,000 coincides with an MVRV percentile reading at the 5th percentile, a zone that historically marks undervaluation and has preceded rallies.
-
Spot metrics tell a more cautious story, with the CVD holding neutral since the 14th of June and Netflow accumulation staying thin, leaving the rally without the buy-side conviction needed to confirm a durable trend.


Be the first to comment