




TLDR
- XRP has remained above an ascending triangle support that has developed over the past eight years.
- The token traded near $1.13 after gaining more than 9% during July.
- Higher lows since 2017 have preserved the long-term bullish chart structure.
- The main Fibonacci support stands at $0.8369, while $1.5620 remains the next major resistance.
- ChartNerdTA reported strong buy signals on lower timeframes but strong sell signals on weekly and monthly charts.
- The analyst said longer-term oversold readings should not automatically discourage market participants.
XRP traded around $1.13 after gaining more than 9% during July, keeping the token above a long-term ascending support line that has remained intact for several years. Market data showed XRP opened the month near $1.0385, reached a high of $1.1828, and recorded a low of $1.0210 before recovering.
The latest monthly chart continued to show XRP trading within an ascending triangle that has developed since 2018. The structure has attracted attention because the price has repeatedly formed higher lows while testing a long-term resistance area. The pattern has also kept focus on higher Fibonacci extension levels if XRP eventually confirms a breakout.
XRP Price Holds Eight-Year Ascending Triangle
The monthly chart shows an ascending triangle that has remained active for about eight years. The lower trendline connects higher lows formed after the 2017 market cycle, including corrections during 2019, 2020, and 2022.
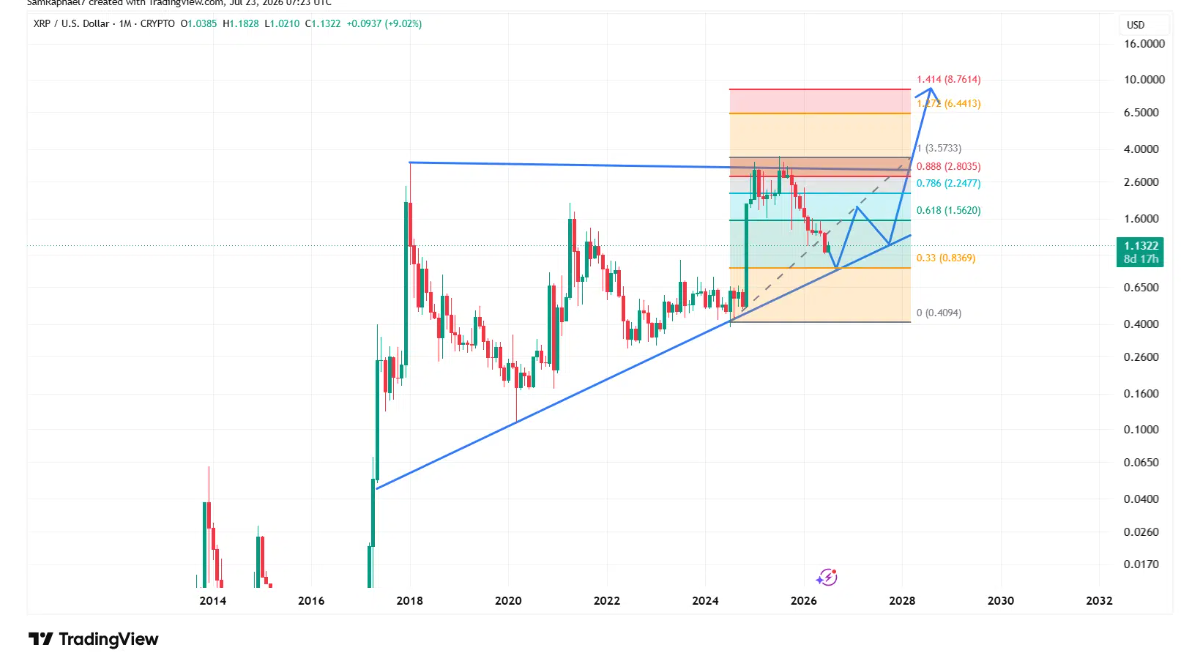
Each correction ended above the previous low. This price behavior indicates buyers continued entering the market at progressively higher levels through different market cycles.
Meanwhile, the upper trendline has acted as long-term resistance since the 2018 peak near $3.30. Every major rally after that period faced rejection around the same resistance zone before reversing lower.
XRP moved above that resistance during 2024 and later climbed beyond $3.60 in July 2025. However, the token later pulled back during the current correction while remaining above the rising support line that defines the broader triangle.

XRP Price Analysis Shows Mixed Momentum Across Timeframes
Market analyst ChartNerdTA reviewed XRP across multiple trading timeframes and reported different signals depending on the chart. According to the analyst, shorter timeframes currently display stronger buying conditions than longer-term charts.
Interesting.. $XRP may be witnessing relief on the lower time frames, however the weekly and monthly suggest an overall technical summary of “strong sell.” We are not out of the woods just yet.
Added context: Similar to how “strong buy” can be an early greed signal, the… pic.twitter.com/YOFLA4JZul
— 🇬🇧 ChartNerd 📊 (@ChartNerdTA) July 23, 2026
The analyst stated, “$XRP is showing strong buy signals from the 30-minute through daily charts, while the weekly and monthly charts still show strong sell ratings.”
ChartNerdTA also said the longer-term readings should not automatically discourage traders. The analyst wrote, “The macro strong sell is a reminder to capitalize on oversold conditions rather than fear missing opportunities.”
Additional chart notes explained that previous daily strong-buy signals often appeared during temporary rebounds before the broader decline continued. The analyst added that stronger weekly momentum would be needed before confirming a larger trend reversal.
XRP Price Holds Key Fibonacci Levels
The Fibonacci retracement measures XRP’s move between $0.4094 and $3.5733. Current price action places XRP price between the 0.33 retracement level at $0.8369 and the 0.618 retracement level at $1.5620.
The $0.8369 level remains the main support area during the ongoing pullback. Holding above this zone keeps the broader structure intact while price remains inside the long-term triangle.
The next resistance sits at $1.5620. A monthly close above that level would place attention on the 0.786 Fibonacci level at $2.2477 and the 0.888 level at $2.8035.
These price levels remain important because they stand between the current market price and the previous cycle high. Traders often monitor these retracement areas for changes in market direction.
Breakout Above $3.57 Opens Higher Extension Targets
The 1.0 Fibonacci level at $3.5733 aligns with the upper boundary of the ascending triangle. This area acted as resistance during the 2018 market peak and also limited the breakout attempt during 2024.
A confirmed monthly close above $3.5733 would place attention on higher Fibonacci extension levels. The first extension target stands at $6.4413, based on the 1.272 Fibonacci extension.
The next extension target appears at the 1.414 Fibonacci extension near $8.7614. These levels become relevant only if XRP records a confirmed breakout above the long-term resistance that has capped price advances for several years.






Be the first to comment